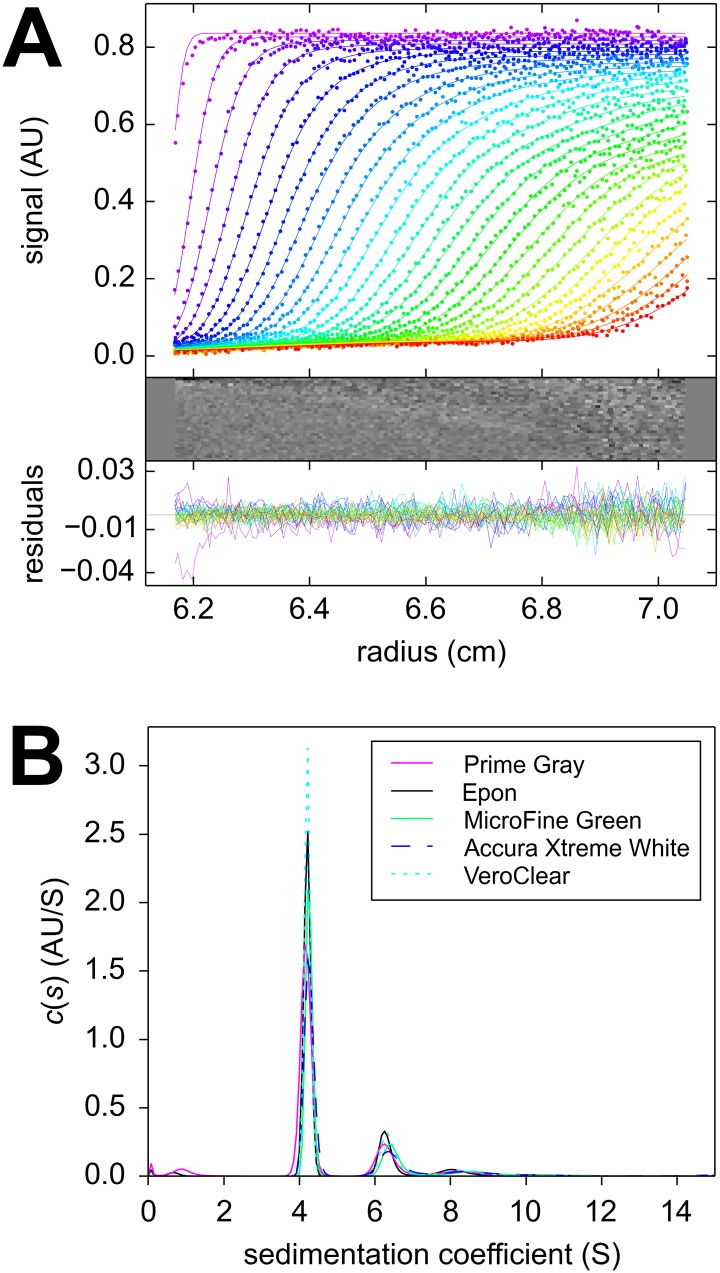
Fig 3. Temporal evolution of radial concentration profiles in a sedimentation velocity experiment with bovine serum albumin in a “prime gray” photopolymer centerpiece.
Panel A: Absorbance data acquired at a rotor speeds of 50,000 rpm at a series of time points (symbols, only every 3rd data point of every 2nd scan shown, with color temperature indicating progress of time). The c(s) fit (lines) results in an rmsd of 0.0065 OD280, with the residuals shown in the small plots as residuals bitmap and superposition. Panel B: The corresponding c(s) distribution (magenta), and for comparison the c(s) distribution from a control in the same run using a standard Epon centerpiece (black); microgreen (green); Xtreme white (blue dashed); in-house clear (cyan dotted).

