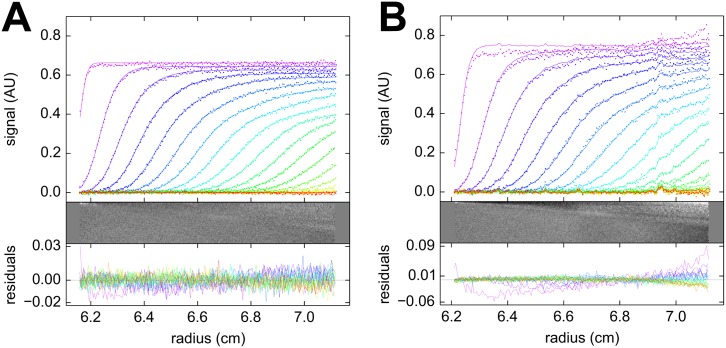
Fig 4. Sedimentation velocity experiment in rectangular cell.
Sedimentation velocity analysis of bovine serum albumin sedimenting at 50,000 rpm in acrylic centerpieces with a sector-shaped (A) and rectangular shaped (B) solution column. The protein sample was identical in both. The upper panel shows the sedimentation boundaries (points, for clarity, only every 2nd data point of every 2nd scan is shown), along with the best-fit c(s) profiles (solid lines). Below are the residuals of the fit as bitmap and overlay plot. The c(s) distribution for both data sets are shown in Fig 5.

