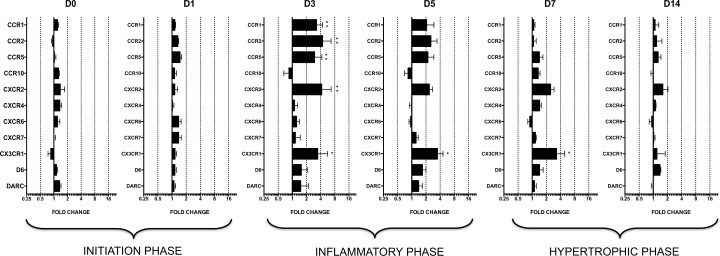
Fig 5. Relative mRNA expression levels of chemokine receptors in aortic banding groups at D0, D1, D3, D5, D7, and D14.
Fold change is calculated as 2(-ΔΔCt) where the calibrator is the mRNA level of the gene in the sham group. Only genes for which the Ct is <32 are presented. For each sample, two qPCRs are performed on different parts of the LV, one from the apex, and another from the base part. Means are calculated for each animal (n = 6 per group). Fold change levels are represented on a logarithmic scale. Data are means (blocks) ± SEM (bars) of n = 6 animals.

