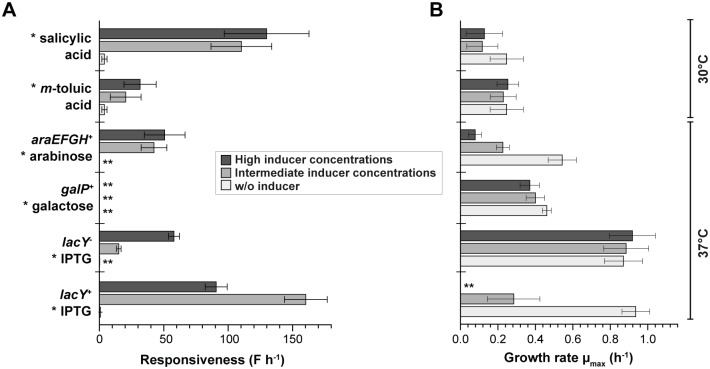
Fig 3. System responsiveness and growth analysis of characterized E. coli expression systems.
A) Responsiveness was calculated using the initial linear slope of the averaged single-cell fluorescence increase in the first 60 min of cultivation. B) For the correlation between cellular growth and the level of induction, growth rates were calculated for at least 10 populations of microfluidic expression cultures without inducer (light grey), as well as with intermediate (grey) and high inducer concentrations (dark grey). Mean and standard deviations derive from 10 individual colonies. Inductors are labeled by asterisks (*). Double asterisks (**) indicate that no calculation was possible.

