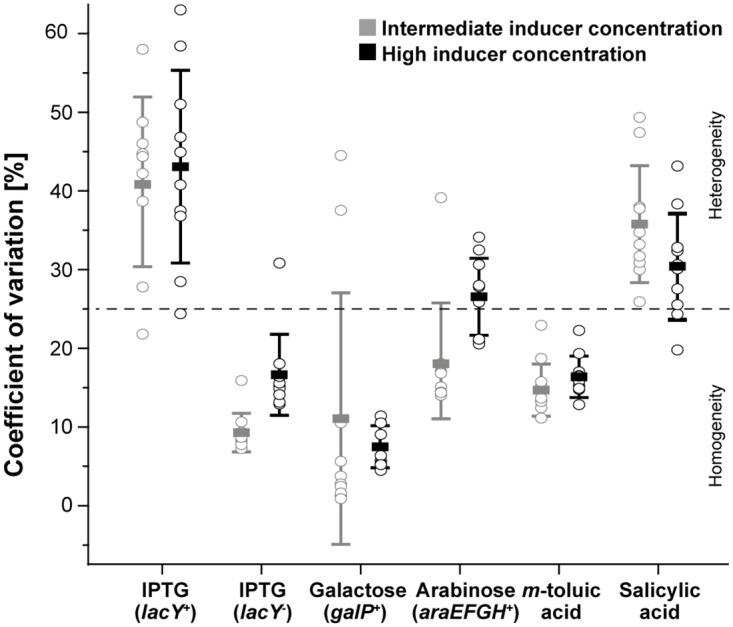
Fig 5. Expression heterogeneity analysis of different E. coli expression systems during microfluidic cultivation for intermediate (grey) and high inducer concentrations (black).

CVs for ten individual colonies (open circles) are plotted together with the respective overall mean (bold dash) and the corresponding standard deviation. The grey dotted line indicates the threshold for expression heterogeneity (CV > 25%) above which colonies are considered as heterogeneous.
