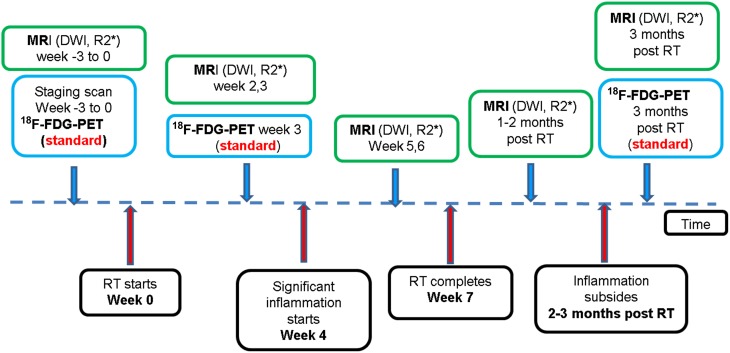
Figure 1.
A flow chart illustrating the study time line. The blue box indicates standard imaging studies; the green box indicates investigational studies. 18F-FDG-PET, fluorine-18 fludeoxyglucose positron emission tomography; DWI, diffusion weighted MRI; RT, radiation therapy. For colour images see online.

