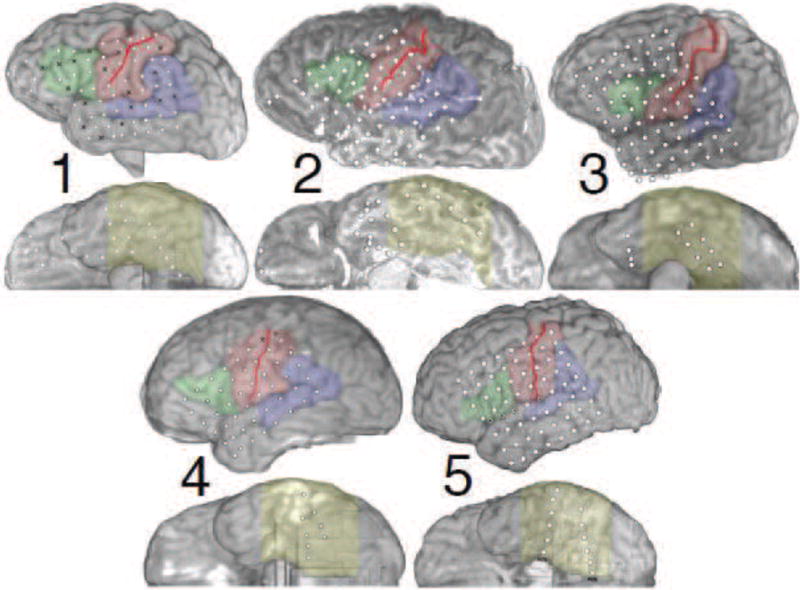
Figure 1.

(Two columns.) Overview of the ECoG coverage for all five subjects. Dots indicate locations of electrodes; black Xs mark channels that were determined to have poor signal quality by a clinical neurophysiologist, and were excluded from analysis. The solid red line indicates the location of the central sulcus, while the colored regions denote broad functional-anatomical regions of interest: Wernicke’s area (blue) including posterior superior temporal gyrus (pSTG), angular gyrus, and supramarginal gyrus; visual association regions in ventral occipital-temporal cortex (VOTC, yellow), including inferior temporal, fusiform, and parahippocampal gyri; sensorimotor cortex (SMC, red) including precentral and postcentral gyri; and Broca’s area (green) including pars triangularis and pars opercularis. The “floating” electrodes for subject 3 were in fact located on the basal surface of the temporal pole, and were moved slightly for visual clarity.
