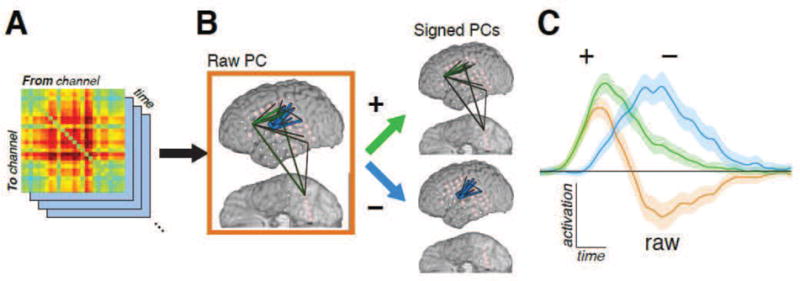
Figure 2.

(Two columns.) Schematic of decomposition of dynamic interaction into signed PCs/FNCs. A: Interaction coefficients A[t] estimated using the tvDBN model form a 3-dimensional array, with the network’s state at each time point represented by an adjacency matrix of interaction strengths from each site to each other site. Equivalently, each channel-channel interaction is seen as an independent signal modulating over time. B: This 3D array is decomposed into PCs, with each PC defined by its loading vector—that is, its spatial distribution among the channel-channel interactions. These PCs are then further decomposed into “signed PCs” by treating the positive loadings and the absolute value of the negative loadings as two separate components. C: When the linear combination of features from the loadings is applied to the original interaction data, the result is a score signal for each signed PC. These scores are averaged across trials to assess both which signed PCs are significantly modulated, as well as the temporal profile of that modulation. Signed PCs that exhibit significant event-related modulation are denoted FNCs. The traces here show the mean and FDR-corrected 95% confidence interval for each depicted component’s modulation during the picture naming task compared to baseline; hence, significance is attained when the colored band does not overlap the horizontal line. The score of the original, un-signed PC (orange) is, by linearity, the score of its positive-weight PC (green) minus that of its negative-weight PC (blue); as this example shows, while the raw PC maximizes the captured variance by combining subnetworks with highly anticorrelated activation, it masks the underlying subnetwork structure.
