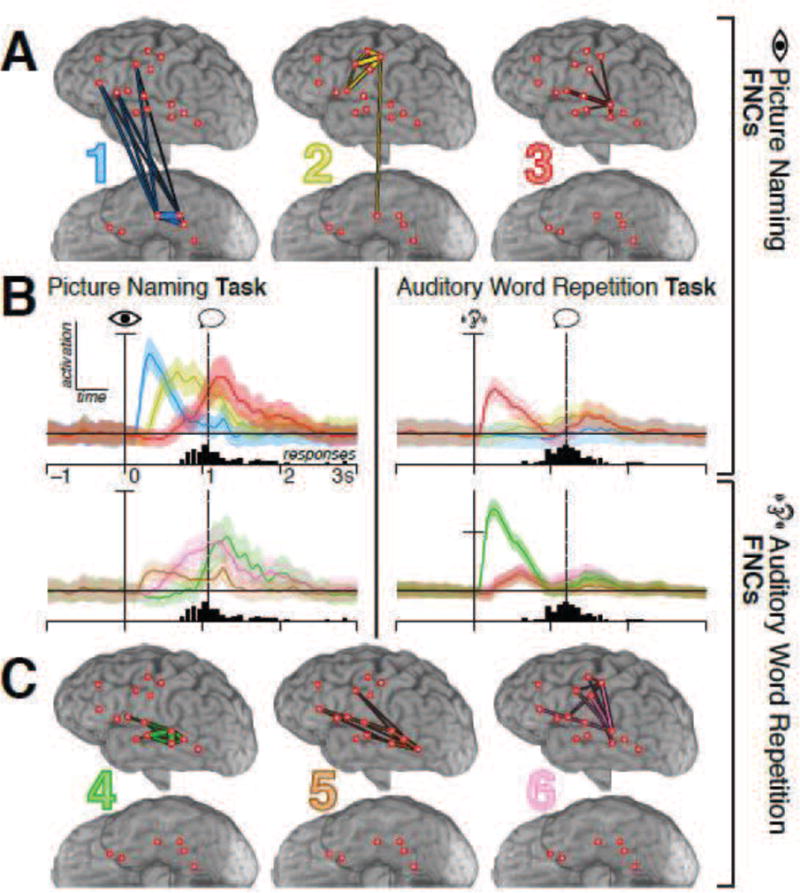
Figure 5.

(Two-column.) Spatial and temporal profiles of FNCs for subject 1. A and C show interactions with significant contributions to each FNC estimated from the picture naming (A) or auditory repetition (C) task, with thicker edges corresponding to stronger contributions. B displays the FNCs’ peri-task activation from 1 s before to 3 s after cue presentation, obtained by applying the spatial loadings depicted in A and C to the interaction data from each task. The color of each trace corresponds to the color indicated on that FNC’s spatial profile in A or C, and all traces are normalized to the standard error of each FNC’s own baseline distribution. Rows correspond to the tasks from which the FNC loadings were computed, while columns correspond to the task the FNC loadings were applied to; hence, for example, the top-right plot shows how the FNCs extracted from the picture naming task modulated during the word repetition task. The vertical solid line denotes the time of cue onset; the histogram below each plot shows the distribution of response times for that task, with the vertical dotted line marking the median response time. Colored bands around each trace show the confidence intervals of the difference between each FNC’s modulation and baseline fluctuations of that FNC, corrected for an FDR of 0.05—hence, significance occurs when the band does not overlap the horizontal line (i.e., difference ≠ 0). Vertical scaling is the same for all plots except for the bottom-right, in which the vertical axis has been compressed to accommodate the dramatic peak of the green FNC, as shown by the tick on the ordinate axis.
