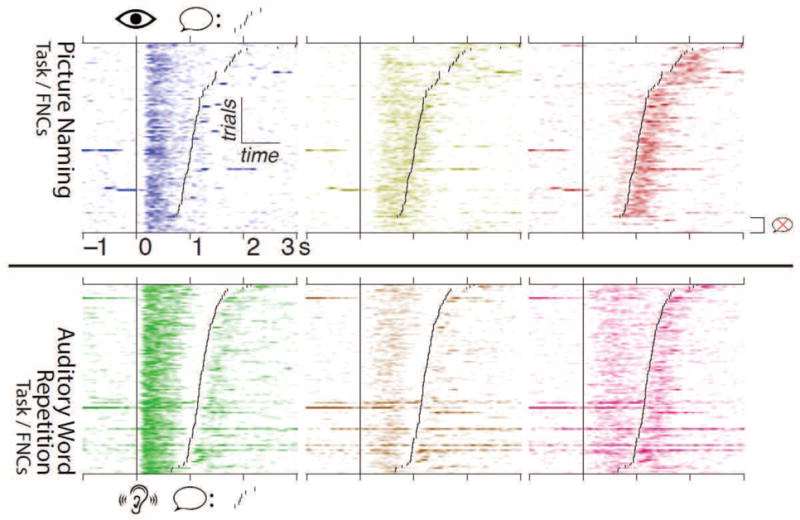
Figure 6.

(Two-column.) Single-trial modulation of FNCs for subject 1, from 1 s pre- to 3 s post-stimulus onset. The top row shows results for FNCs computed from picture naming during the picture naming task, while the bottom row shows FNCs computed from word repetition during the word repetition task. The coloration of each plot corresponds to the color for each FNC shown in Figure 5, with darker colors corresponding to stronger activation. Trials are aligned to cue onset (vertical line), and have been sorted according to the subject’s response time (smaller black lines); trials in which the subject didn’t respond are grouped at the bottom. Each FNC exhibits a clear cue- and/or response-aligned pattern of modulation.
