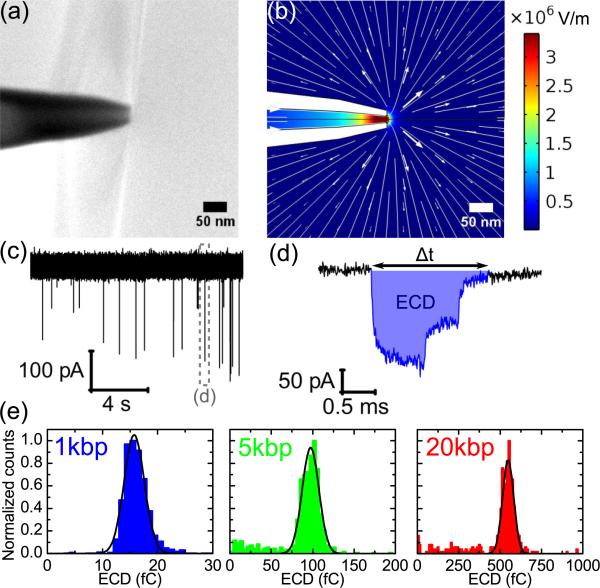
FIG. 1.
(a) Scanning electron microscope image of a typical quartz nanopore. (b) Finite-element analysis of the electric-field profile at a voltage of +600 mV using the geometric model given in Ref. [15]. Lines represent tangents to the electric field. (c) Typical current trace showing downward spikes due to DNA translocation interrupting the baseline. The event in the dashed area is shown at greater time resolution in (d), which also shows the event charge deficit (ECD) in blue—the integrated area of the event relative to the baseline. (e) Histograms of ECD for 1, 5, and 20 kbp DNA with N = 1119, N = 764, and N = 456 translocations, respectively. Each length was measured separately at +600 mV with a DNA concentration of 1.6 nM.

