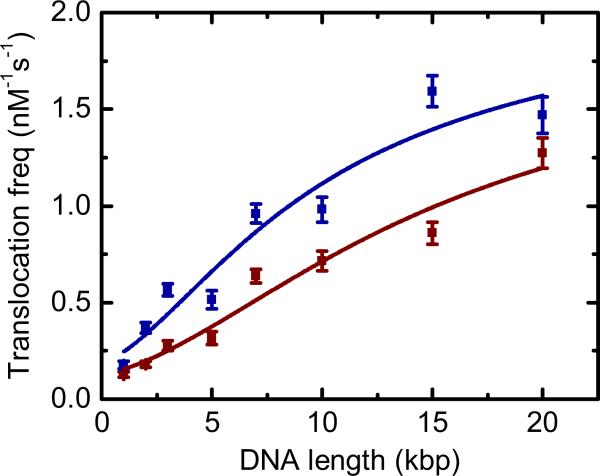
FIG. 12.
Translocation frequency as a function of DNA length for the DNA sample given in Table II at +600 mV. The two colors represent data from two nanopores with fits yielding α = 0.10 ms−1, , and (blue data) and α = 0.12 ms−1, , and (brown data). Error bars represent the standard errors of the fits.

