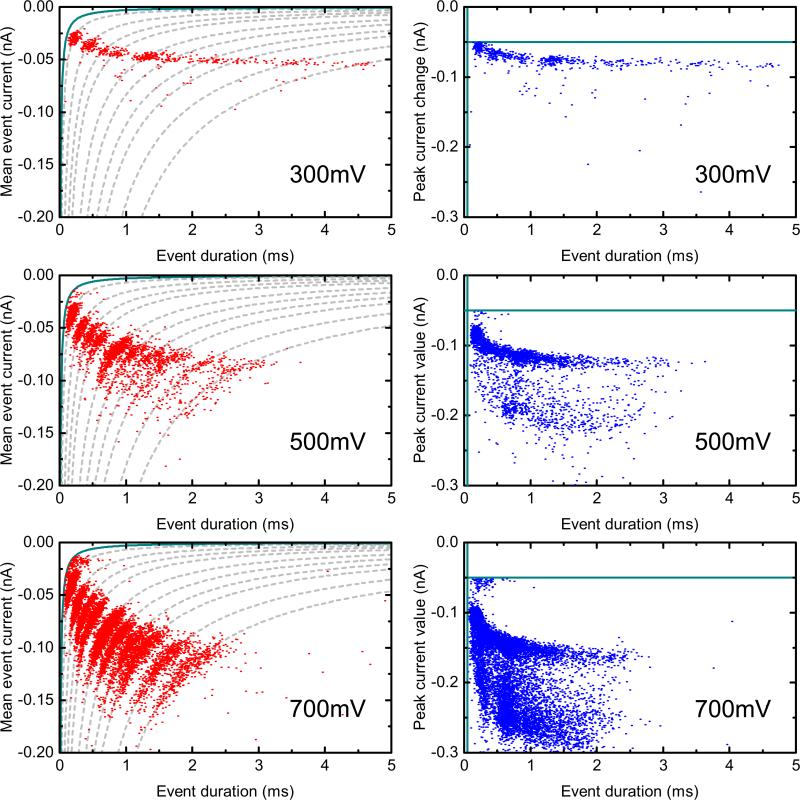
FIG. 15.
Left column: Mean event current against event duration for all translocations. The green line shows the 3-fC threshold set in the analysis. Dashed lines indicate constant ECD with values determined from the center of Gaussian peaks fitted to each ECD histogram. N = 637 (+300 mV), N = 3174 (+500 mV), and N = 11 661 (+700 mV). +300 and +500 mV were recorded for approximately 20 min and +700 mV was recorded for approximately 30 min. Right column: Corresponding plots of peak current value against event duration. The threshold limits of 50 μs and 50 pA are also marked as green lines. Events cluster outside the threshold limits, indicating that nearly no translocations are missed.

