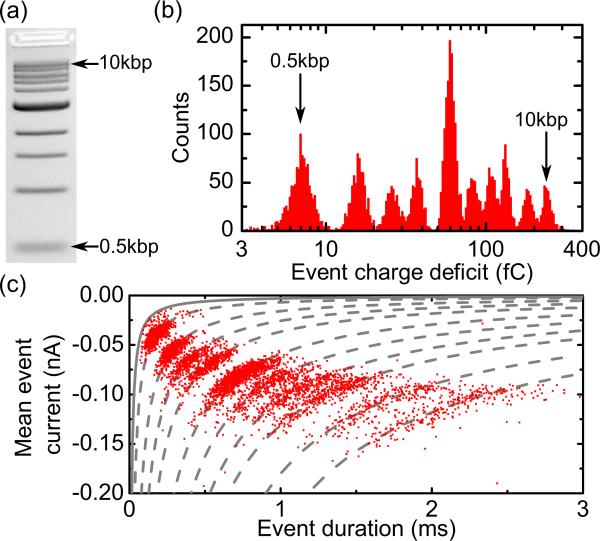
FIG. 2.
(a) Agarose gel (1%) electrophoretogram of the DNA sample containing 10 lengths in the range 0.5–10 kbp. (c) ECD histogram for 5711 translocation events recorded at +600 mV. The histogram is logarithmically binned and the peaks corresponding to the shortest and longest DNA lengths are labeled. (c) Scatter plot of mean event current against event duration for same events as in (b). The dashed gray lines are fits according to and the solid line shows the 3-fC threshold.

