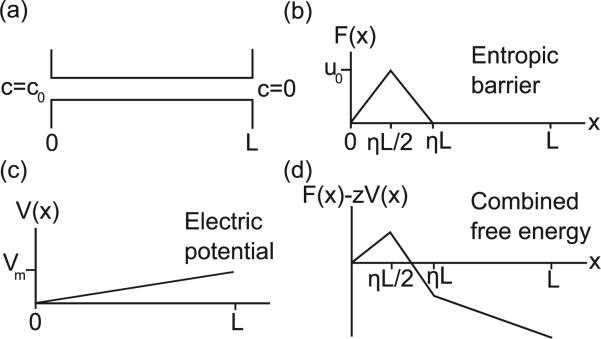
FIG. 3.
(a) Modeled 1D geometry with length L, concentration c0 in the sample reservoir and zero in the opposing reservoir. (b) Triangular profile for the entropic barrier F(x) with height u0. η parameterizes how far the barrier extends. (c) The electric potential (Vm is the applied voltage) and (d) combined free-energy profile for the nanopore where z is the effective DNA charge.

