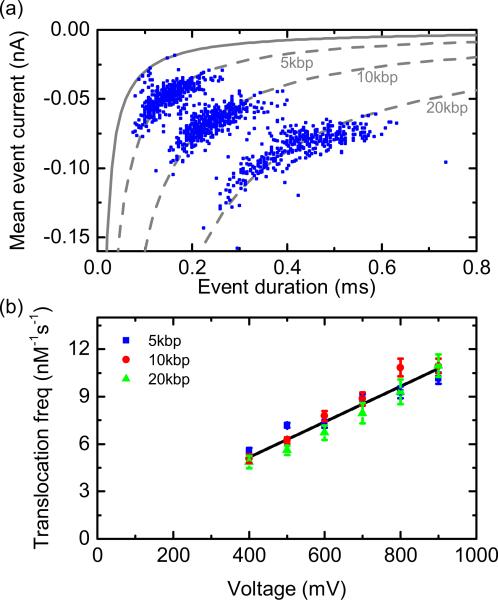
FIG. 5.
(a) Scatter plot of 1168 translocations from a sample containing 5, 10, and 20 kbp with each length at a concentration of 0.12 nM and using 1M KCl electrolyte with +600 mV applied voltage. The dashed gray lines are fits according to , and the solid line shows the 3-fC threshold. (b) Corresponding translocation frequency against voltage for 5, 10, and 20 kbp—the translocation frequency values are significantly higher than that observed in 4M LiCl [Fig. 4(b)] due to the higher effective DNA charge in 1M KCl. The line shows a linear fit to all data points yielding a gradient of 0.011 nM−1s−1mV−1. Error bars are from the standard errors of the Gaussian fits to the ECD histogram.

