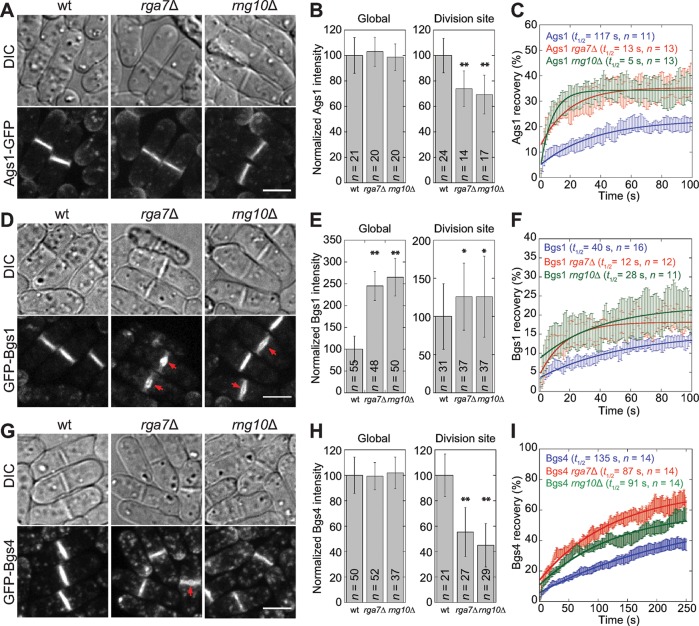
FIGURE 5:
rng10Δ and rga7Δ affect accumulation and dynamics of glucan synthases at the division site. Localization (A, D, G), protein levels (B, E, H), and dynamics (C, F, I) of Ags1 (A–C), Bgs1 (D–F), and Bgs4 (G–I) in wt, rga7Δ, and rng10Δ cells at 25°C. Arrows in D and G mark the bulges at the center of septa. (B, E, H) Global and division-site protein levels. *p < 0.05 and **p < 0.0001 compared with wt. (C, F, I) FRAP analyses of glucan synthases at the division site. Half of the division site was bleached at time 0. Mean ± 1 SEM. Bars, 5 μm.

