FIGURE 1:
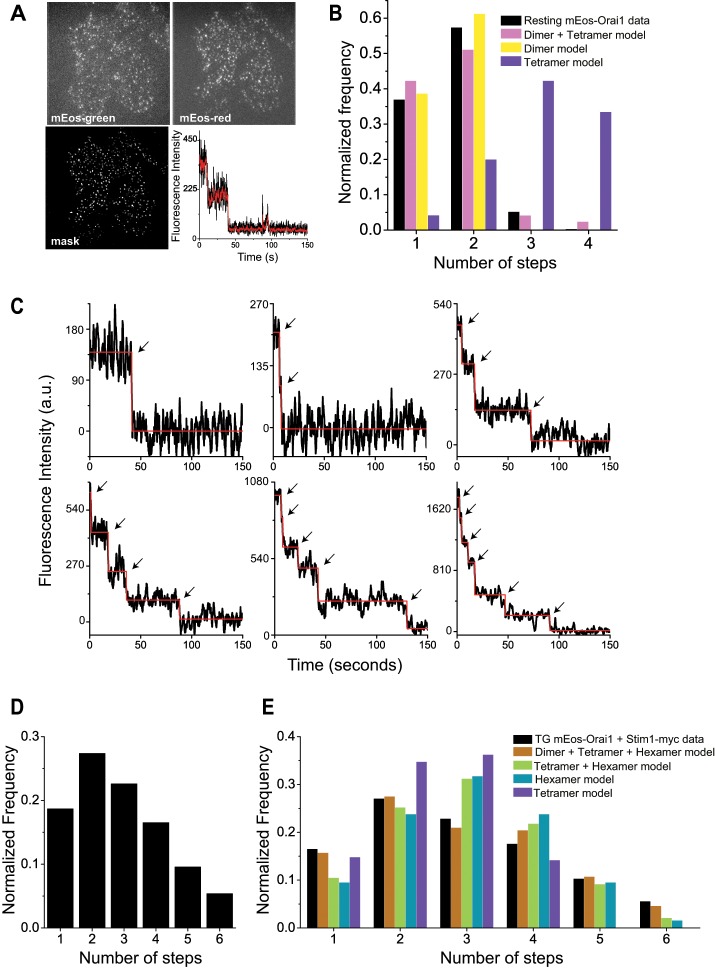
Orai1 displays variable stoichiometry in resting and store-depleted cells. (A) Representative raw images of Orai1−/− MEF cell expressing mEos-Orai1. Top, sparse distribution of mEos-green and mEos-red fluorescence after photoconversion. Bottom, image mask after applying LoG filter and representative raw fluorescence trace from one spot (black line) and after Kalman averaging (red line). (B) Histogram of mEos-Orai1 bleaching steps obtained from resting Orai1−/− MEFs (black bars; 300 spots) and binomial fitting of experimental data to various models (colored bars) from Table 1. Representative examples of discrete fluorescence photobleaching steps (C) and histogram (D) obtained from store-depleted Orai1−/− MEFs expressing mEos-Orai1 and Stim1-myc (900 spots). Dark trace in C is the raw fluorescence signal overlaid with a red line from automatic step detection. (E) Binomial fitting of data (black bars) from D to various models (colored bars) from Table 2.

