
FIGURE 8:
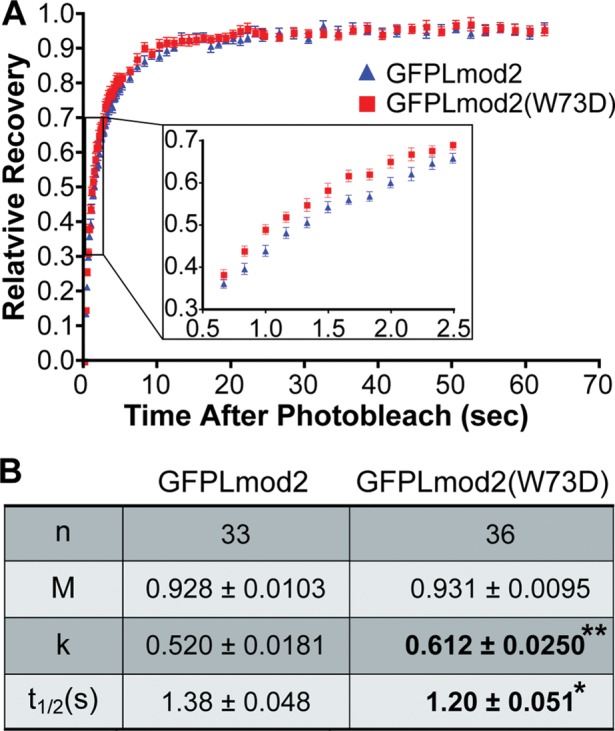
Fluorescence recovery after photobleaching of GFP-Lmod2 and GFP-Lmod2 (W73D). (A) Mean relative recovery after photobleaching over time for GFP-Lmod2 (blue triangles) and GFP-Lmod2 (W73D) (red squares). (B) Recovery data fit using nonlinear regression curves with the single-exponential association equation R = M[1 − exp(−kt)] for each individual cell, where R is the relative recovery of fluorescence at time t. Mean mobile fraction (M), rate (k), and half-time of recovery (t1/2) are indicated ± SEM. Bold indicates values that are statistically significantly different between GFPLmod2 and GFPLmod2 (W73D). n = 34–36 from three independent cultures; *p < 0.05, Student’s t test.