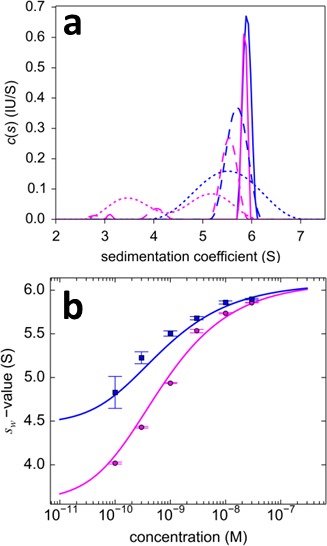
Figure 10. Dilution series analysis of GluA2-GluA3 interaction.

Sedimentation at 50,000 rpm of a dilution series of DL488-GluA2 with equimolar rsEGFP2-GluA3 was observed with 13 mW excitation beam in FDS-SV, causing a decrease of rsEGFP2 signal with time-constant of 5.5×10⁻⁴/sec. (a) Sedimentation coefficient distribution of the decaying signal component of rsEGFP2-GluA3 (blue, reporting on all blue species in Figure 7) and the constant signal component of DL488-GluA2 (magenta, reporting all magenta species in Figure 7) at 30 nM (solid lines), 3 nM (dashed lines) and 0.3 nM (dotted lines). Raw data and fits are in Figure 9. (b) Weighted-average sedimentation coefficients sw for the rsEGFP2-GluA3 (blue circles) and DL488-GluA2 (magenta circles), with 68% CI error bars from Monte-Carlo analysis. The solid line is the best-fit isotherm for a linked homo- hetero-dimerization equilibrium, using a fixed Kd,22 of 27.1 nM for the separately determined GluA2 homo-dimerization. The best-fit estimate for the hetero-dimerization Kd,23 is 0.32 [0.20–0.46] nM.
