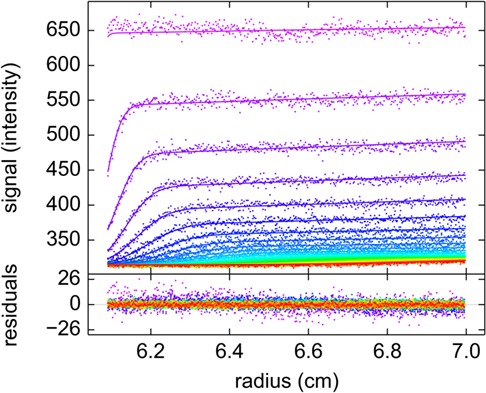
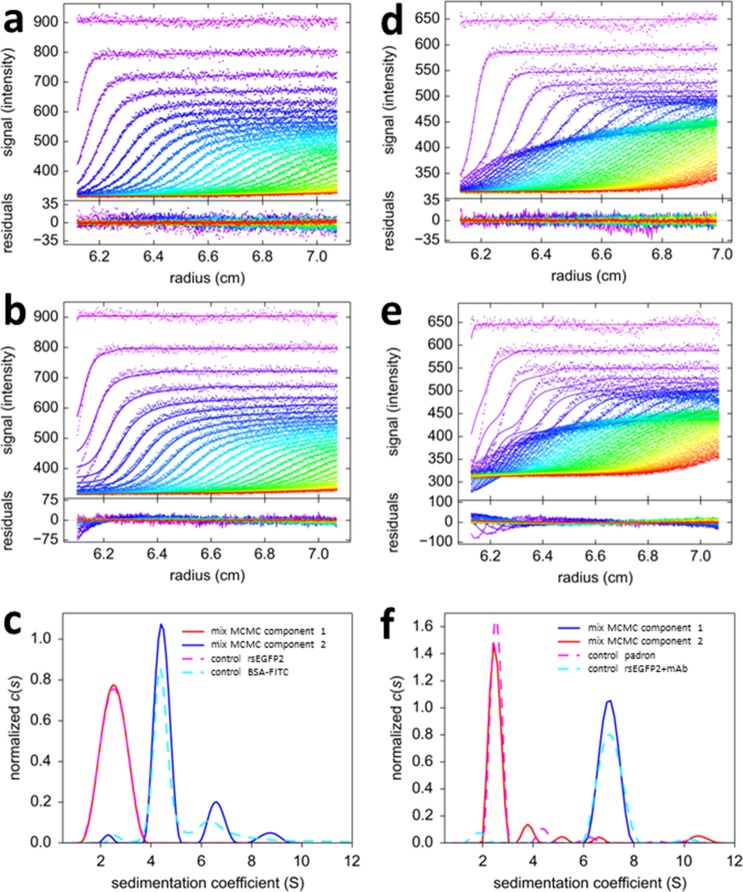
Figure 3. Mono-chromatic multi-component (MCMC) decomposition of mixtures.
(a) Evolution of radial fluorescence profiles of 20 nM rsEGFP2 and 30 nM FITC-BSA sedimenting at 50,000 rpm and 20°C. Raw data are shown as points with higher color temperature indicating the passage of time (only every second scan shown), and solid lines are the best-fit based on the MCMC distribution model with two components, producing residuals as shown in the lower panel attached. (b) An impostor fit with a conventional c(s) analysis not accounting for time-dependent signal increments, but compensating their effect on plateau levels by artificial inclusion of time-dependent baseline offsets, creates large misfit in the boundary region. (c) The resulting sedimentation coefficient distributions of each fluorophore component from the MCMC analysis of the mixture (solid lines) and in separate control experiments with individual samples (dashed lines). (d) Fluorescence sedimentation data acquired under the same conditions for a mixture of 20 nM rsEGFP2, 20 nM Padron, and 50 nM anti-GFP mAb, presented in the same format as (a). (e) Analogous to (b), showing the best-fit ‘conventional’ boundary model not accounting for time-dependent signal increments while including artificial baseline parameters. (f) Resulting sedimentation coefficient distributions from the MCMC analysis (solid lines) and standard control experiments (dashed lines).
Figure 3—figure supplement 1. Sedimentation signals of rsEGFP2-GluA3.


