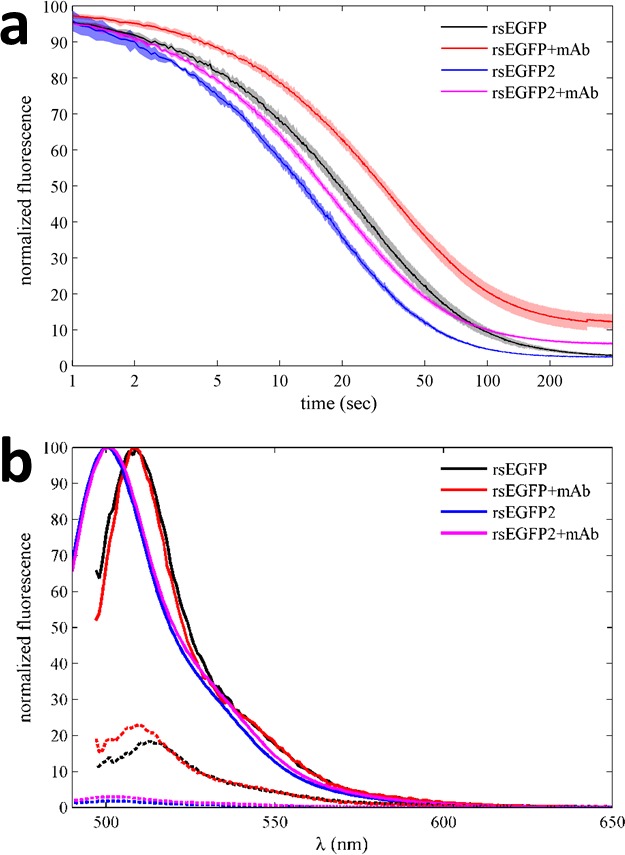
Figure 4. Photoswitching behavior and fluorescence emission spectra of EGFP variants in the absence and presence of GFP antibody in a benchtop spectrofluorometer.

(a) Normalized fluorescence data of 500 nM rsEGFP in the presence (red) and absence (black) of equimolar anti-GFP mAb, monitored at 508 nm during excitation at 490 nm. Equivalent experiments for rsEGFP2 in the presence (magenta) and absence (blue) of the same antibody, measured at 502 nm during 483 nm excitation. The incident power density is 3 mW/cm2. The data shown here represent the average of at least four measurements for each sample, with the line width (or patch width) representing the data acquisition errors. (b) Normalized fluorescence spectra of 500 nM rsEGFP with excitation at 490 nm in the presence (red) and absence (black) of equimolar anti-GFP mAb, before (solid lines) and after (dotted lines) photoswitching. Equivalent emission spectra for rsEGFP2 with 483 nm excitation in the presence (magenta) and absence (blue) of the same antibody, before (solid lines) and after (dotted lines) photoswitching.
