
Figure 6. Blinking fluorescence SV data.
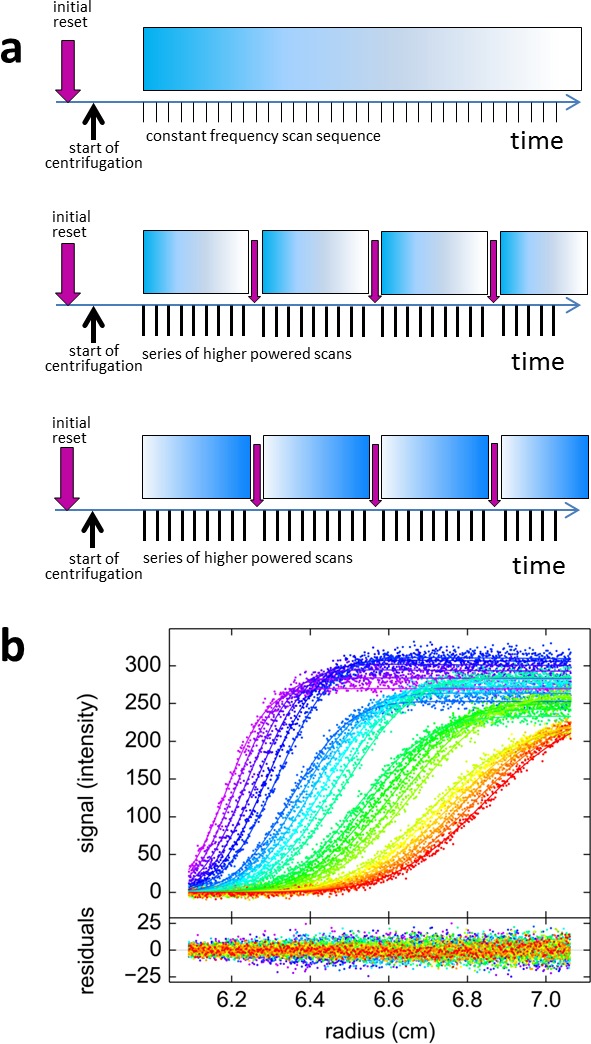
(a) Cartoon illustrating the timing of events in standard vs. blinking experiments. Dependent on sample history, an initial brief illumination with 405 nm may be applied prior to start of centrifugation. In standard time-domain experiments (top) a series of 488 nm scans at constant frequency is initiated shortly after full rotor speed is reached. It causes a gradual depletion of signals for molecules switching off, depicted by the fading blue bar, such as shown in Figure 2c. For blinking experiments (middle and bottom) the sequence of scans was briefly interrupted at select time points (indicated by purple arrows) by short pulses of high-power 405 nm illumination, switching on molecules that switch off at 488 nm such as rsEGFP2 in Figure 2e, or switching off molecules that switch on at 488 nm such as Padron in (b), respectively. (b) Example of blinking data from 30 nM Padron sedimenting at 50,000 rpm and 20°C. Fluorescence scans were acquired with 488 nm excitation in ~5 min intervals (only every second scan shown), interrupted three times by 2 min exposure of the spinning rotor to 405 nm light. During the data acquisition cycles the fluorescence signal increases, due to switching on of Padron, but the increase is reversed each time in the 405 nm light that switches Padron to the off state. At these time points, gaps in the boundary overlay can be visually discerned; these appear largely due to the decreasing signal magnitude of the boundary. The complete fluorescence or dark state is not reached in these cycles, and the fluorescence signal magnitude after 405 nm exposure is treated as a fitting parameter. The solid line is the best-fit combined sedimentation/photoswitching model of a single species with apparent molar mass of 26.9 kDa and s-value of 2.58 S.