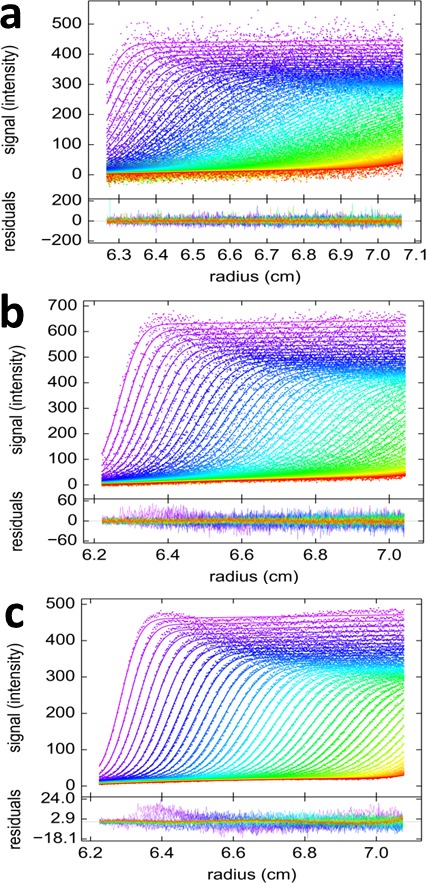
Figure 9. Competitive self-association and hetero-association of DL488-GluA2 and rsEGFP2-GluA3.

Scan data were acquired by FDS-SV, continuously scanning with 488 nm excitation during the sedimentation at 50,000 rpm, 20°C. Data shown are for equimolar concentrations at 0.3 nM (a), 3 nM (b) and 10 nM (c). Solid lines and residuals are from the MCMC decomposition, with pre-determined switching parameters for rsEGFP2-GluA3, leading to distributions shown in Figure 10a.
