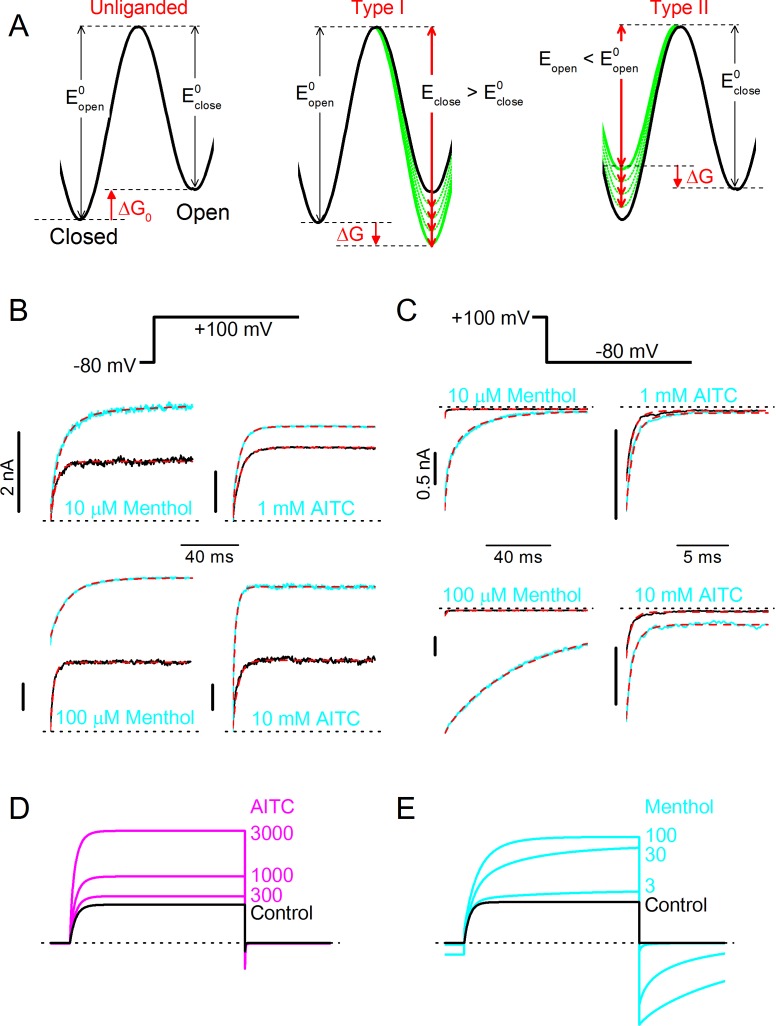
Figure 5. Type I (menthol-like) versus Type II (AITC-like) TRPM8 agonists.
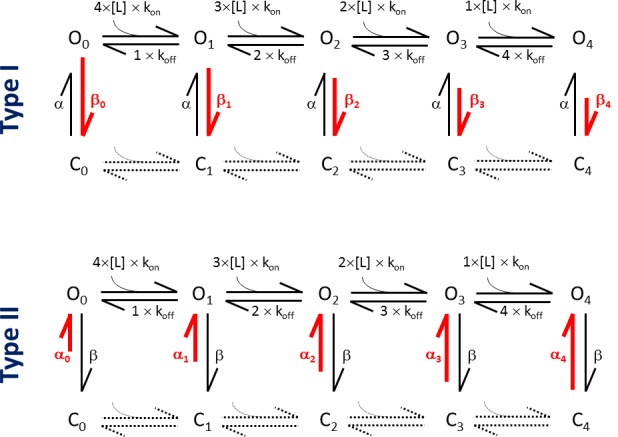
(A) (left) Energy diagram for the transition between the closed and open channel conformation in a non-liganded channel. Steady-state equilibrium is determined by ΔG0, whereas Eopen and Eclose determine the opening and closing rates, respectively. (right) Alteration in the energy profile upon binding of Type I and Type II ligands. The black line represents the non-liganded channel, whereas the green lines represent channels with 1–4 bound ligands. The corresponding kinetic schemes are provided in Supplementary Figure 2. (B,C) Activation (B) and deactivation (C) time courses in the absence and presence of the indicated concentrations of menthol or AITC. Overlaid dashed lines represent global fits to the control and ligand-activated current traces. (D,E) Model predictions corresponding to the experimental data shown in Figure 4C,D.
Figure 5—figure supplement 1. Kinetic schemes of the MWC model, depicting the differential effects of Type I and Type II ligands.


