
Figure 2.
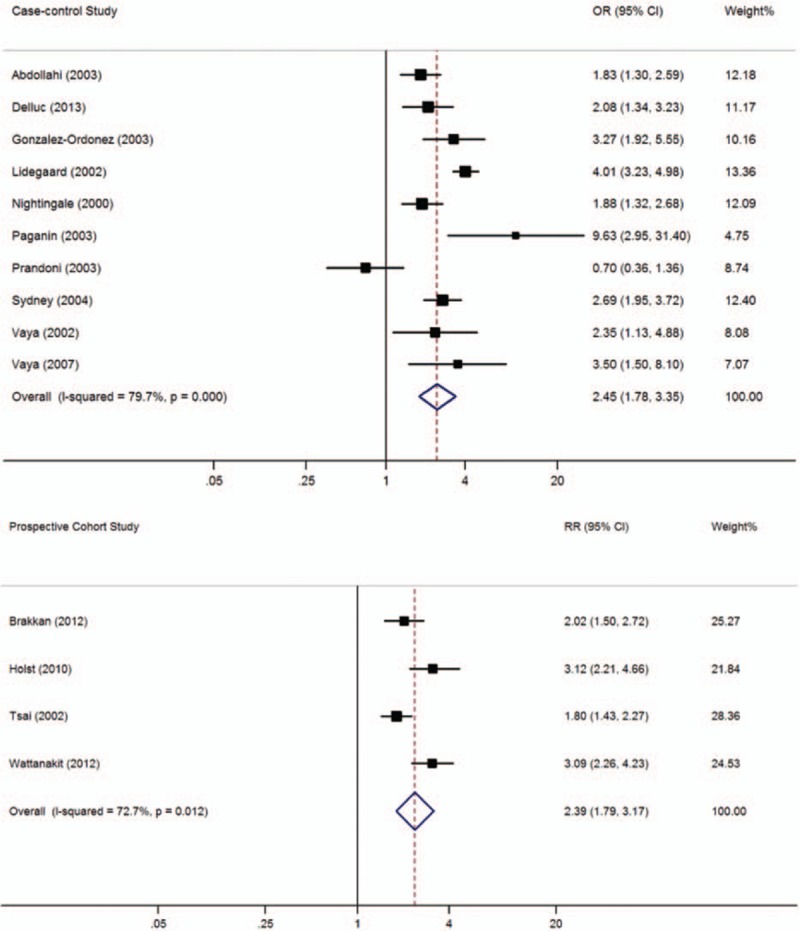
Meta-analysis of the effect of obesity (body mass index ≥30 kg/m2) on venous thromboembolism (based on 10 case-control and 4 cohort studies). Squares represent point estimates for effect size expressed as an OR/RR with the size proportional to the inverse variance of the estimate. Diamond represents pooled estimate. Lines represent 95% CIs. CI = confidence interval, OR = odds ratio, RR = relative risk.