
Figure 8.
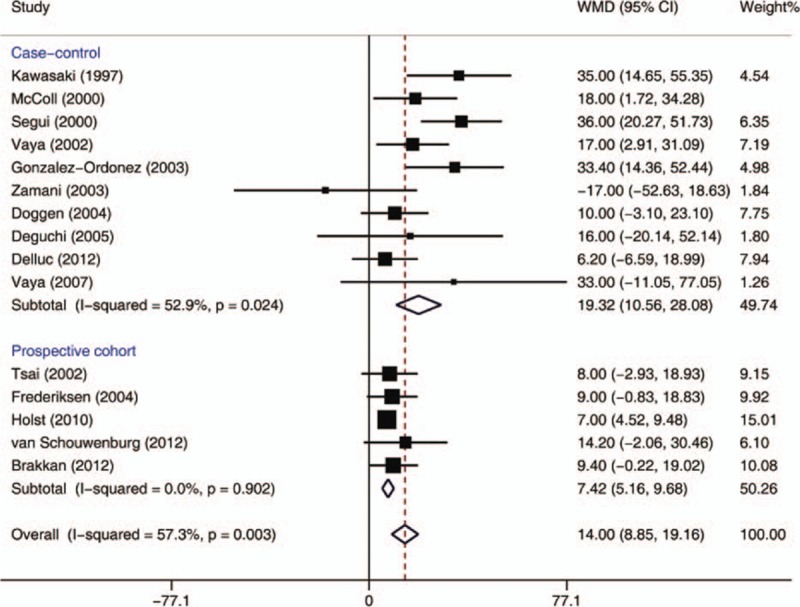
Meta-analysis of the effect of triglyceride concentrations (mg/dL) on venous thromboembolism (based on 10 case-control and 5 cohort studies). Squares represent point estimates for effect size expressed as a WMD with the size proportional to the inverse variance of the estimate. Diamond represents pooled estimate. Lines represent 95% CIs. CI = confidence interval, WMD = weighted mean difference.