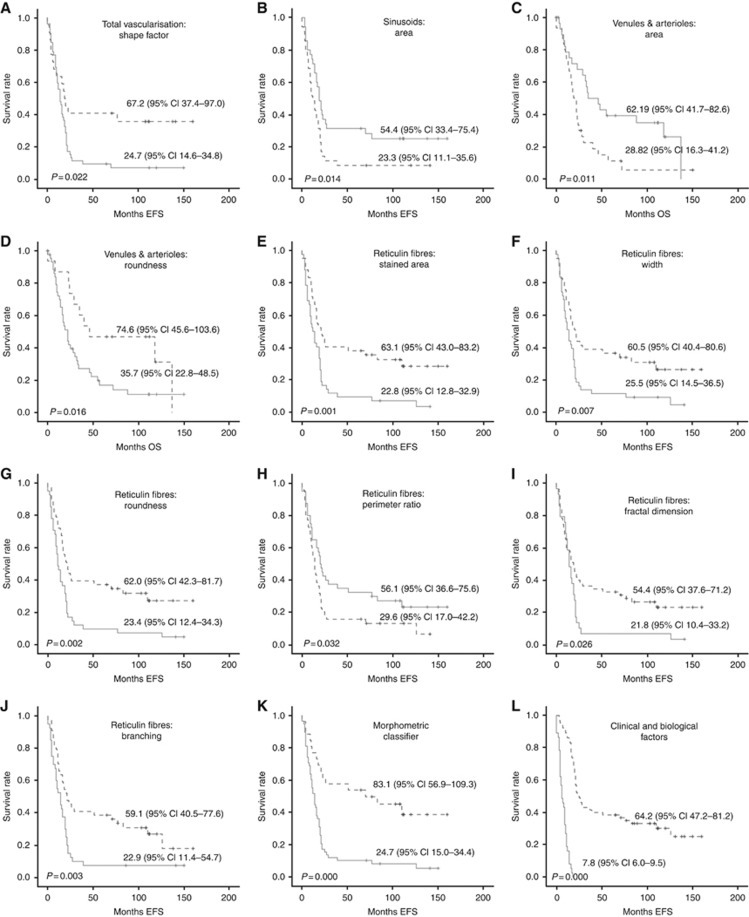
Figure 2.
Kaplan–Meier graphs showing the different accumulated EFS or OS depending on different variables. In all cases, the straight line corresponds to the group under the data used for dichotomization, and the discontinuous line corresponds to the group over the data used of dichotomization. These data are shown in Table 3. P-values and survival rates are shown. (A–D) Blood vessels morphometric variables. (A) Shape factor of total blood vascularisation. (B) Area of sinusoids. (C) Area of venules and arterioles. (D) Roundness of venules and arterioles. (E–J) Ret Fs morphometric variables. (E) SA. (F) Width. (G) Roundness. (H) Perimeter ratio. (I) Fractal dimension. (J) Branching. (K) Patients grouped depending of the amount of morphometric variables related to ultra-high-risk of progression. (L) Definition of ultra-high-risk patients according to clinical and biological factors (definition currently under debate).

