FIGURE 4.

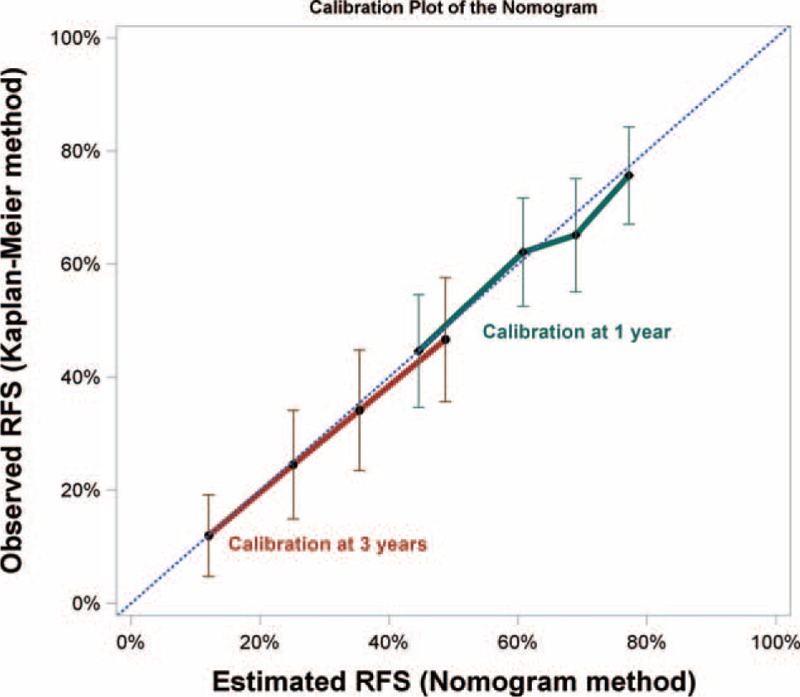
Calibration plot of the nomogram. Calibration curves of the nomogram at 1 and 3-year showed good correlation between predicted and observed outcomes. The calibration curves were close to the 45-degree line.

Calibration plot of the nomogram. Calibration curves of the nomogram at 1 and 3-year showed good correlation between predicted and observed outcomes. The calibration curves were close to the 45-degree line.