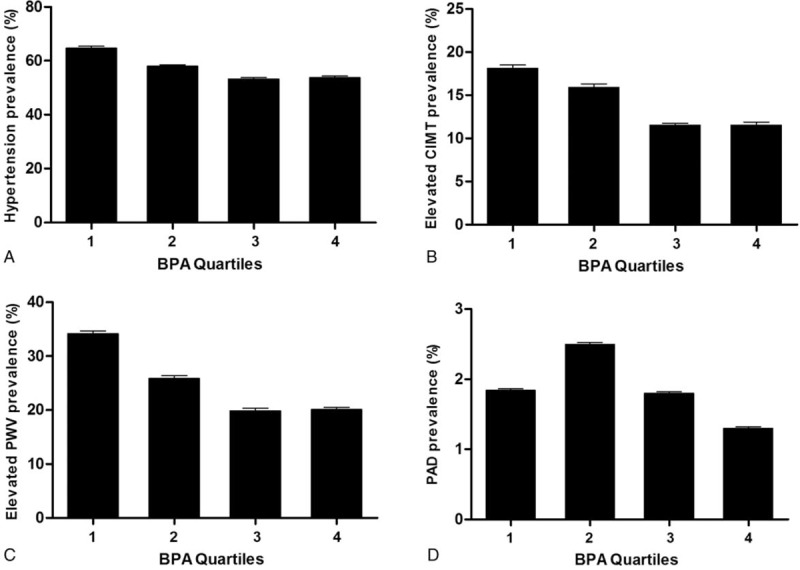
FIGURE 1.

Prevalence (95% confidence interval) of hypertension and early macrovascular diseases across urinary bisphenol A quartiles. (A) Hypertension, P for trend < 0.0001; (B) elevated carotid intima-media thickness (CIMT), P for trend < 0.0001; (C) arterial stiffness, P for trend < 0.0001; and (D) peripheral artery disease (PAD), P for trend = 0.26. Logistic regression model was used to test P values for trend of outcomes across BPA quartiles, and BPA was modeled as an ordinal variable coding with regard to its quartiles as 1, 2, 3, and 4. BPA = bisphenol A.
