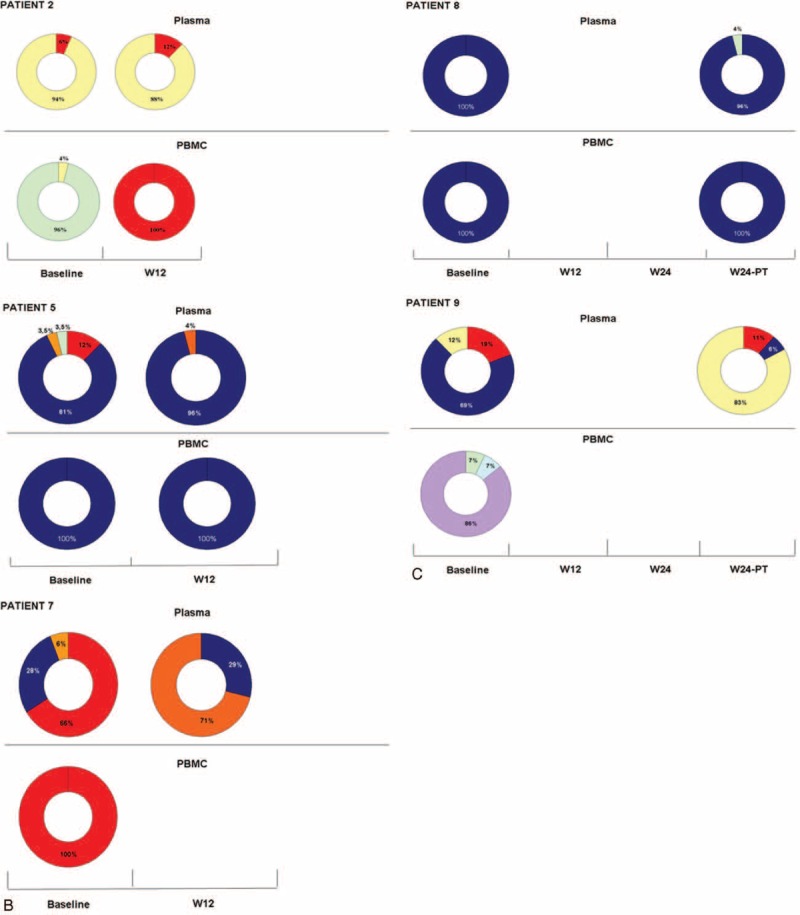
FIGURE 1 (Continued).

Dynamic of viral population detected by next-generation sequencing in plasma and PBMC of NR/RE patients during P–R treatment: the ring chart represents the percentage of HCV infecting genotypes (A) NR with at least 3 sequential plasma samples tested. (B) NR with plasma samples tested at BL and W12. (C) In RE, plasma samples were tested at BL and W24-PT because HCV–RNA was undetectable at W12 and W24 of treatment. Each genotype is identified by a different color: G1a = red, G1b = blue, G1c = yellow, G2a = orange, G3a = green, G4a = light blue, and G4c/d = violet. BL = baseline, HCV = hepatitis C virus, NR = nonresponder, PBMC = peripheral blood mononuclear cell, RE = relapser, RNA = ribonucleic acid.
