FIGURE 2.

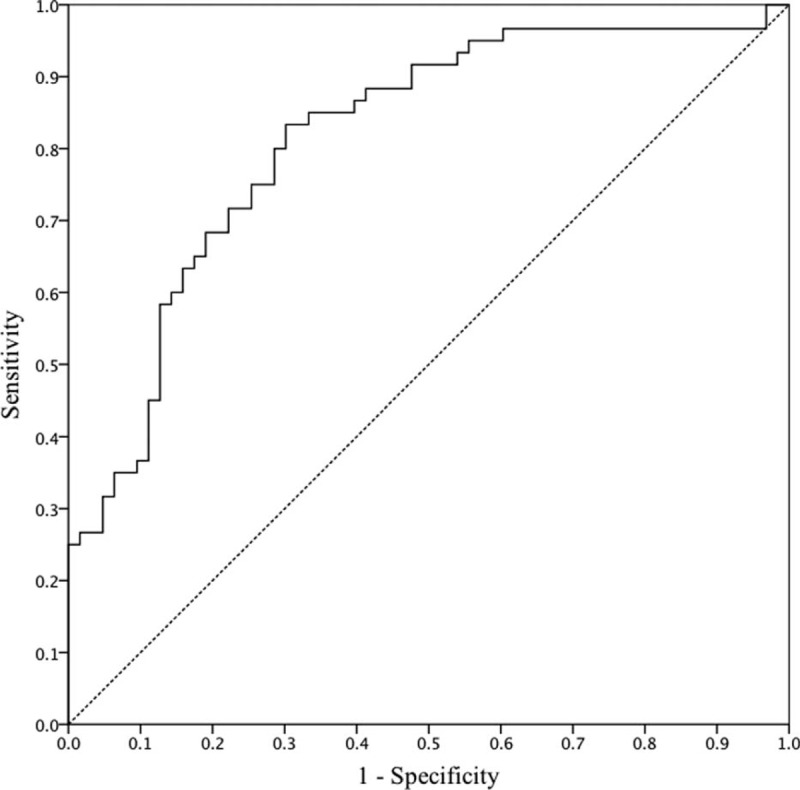
Receiver operating characteristic (ROC) curve for VBED20. The area under the ROC curve was 0.815, and the optimal cut-off value for VBED20 was 40.8%, with a sensitivity of 0.833 and a specificity of 0.698.

Receiver operating characteristic (ROC) curve for VBED20. The area under the ROC curve was 0.815, and the optimal cut-off value for VBED20 was 40.8%, with a sensitivity of 0.833 and a specificity of 0.698.