FIGURE 3.

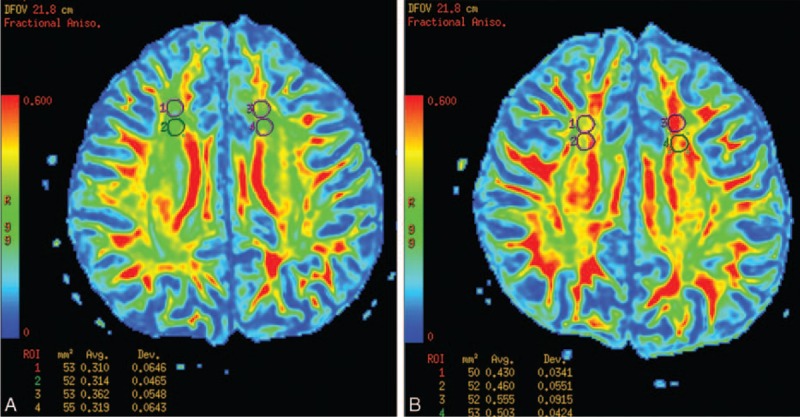
The FA maps of a patient (A) and a matching healthy control (B). The FA values of the patient in bilateral frontal NAWMs was lower compared to the control.

The FA maps of a patient (A) and a matching healthy control (B). The FA values of the patient in bilateral frontal NAWMs was lower compared to the control.