FIGURE 4.

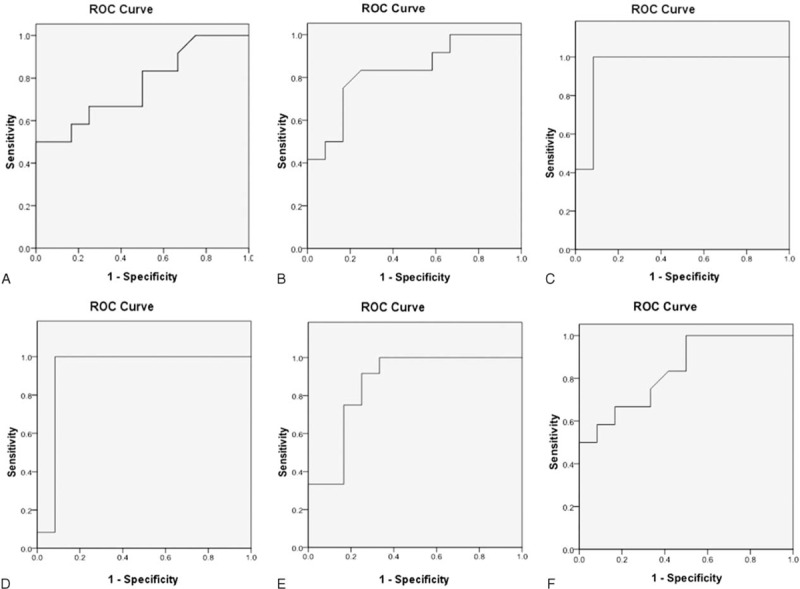
ROC curves of FA values in left frontal (A), right frontal (B), left orbitofrontal (C), right orbitofrontal (D), left temporal (E) and right temporal (F) NAWMs. AUC of FA value in left orbitofrontal NAWM is largest.

ROC curves of FA values in left frontal (A), right frontal (B), left orbitofrontal (C), right orbitofrontal (D), left temporal (E) and right temporal (F) NAWMs. AUC of FA value in left orbitofrontal NAWM is largest.