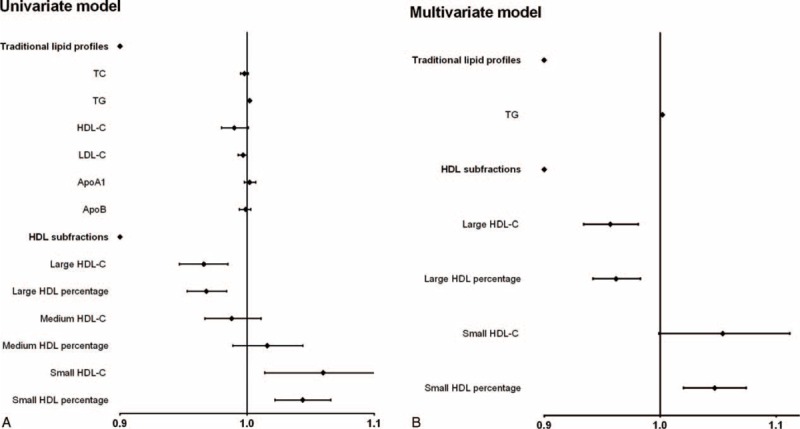
FIGURE 2.

Traditional lipid profiles and HDL subfractions in relation to the incidence of hypertension. The multivariate model was adjusted for age, gender, obesity, smoking, alcohol, diabetes, dyslipidemia, and antihypertensive drugs. Apo = apolipoprotein, HDL = high-density lipoprotein, HDL-C = high-density lipoprotein-cholesterol, LDL-C = low-density lipoprotein-cholesterol, TC = total cholesterol, TG = triglyceride.
