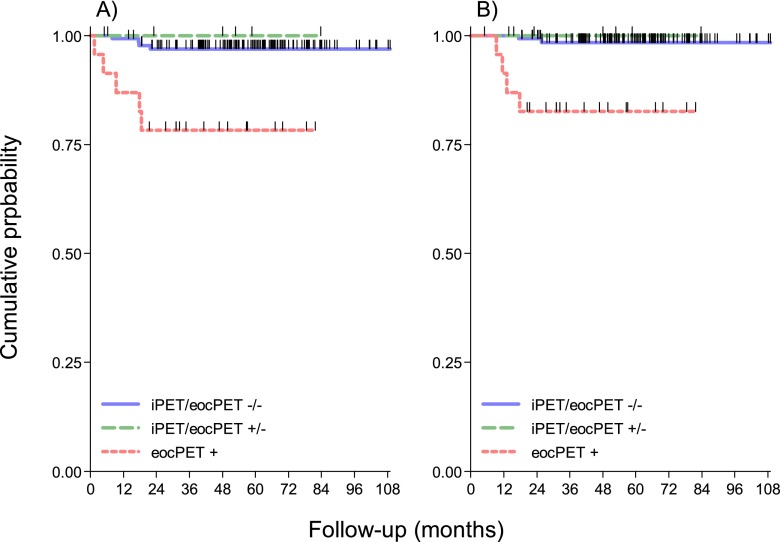
Figure 3.
(a) Kaplan–Meier projections of progression-free survival, stratified by positron emission tomography (PET) response at interim (iPET) or at the end of chemotherapy (eocPET). Log-rank p < 0.0001. (b) Kaplan–Meier projections of overall survival, stratified by fluorine-18 fludeoxyglucose (18F-FDG)-PET response during and after chemotherapy. Log-rank p = 0.00005.

