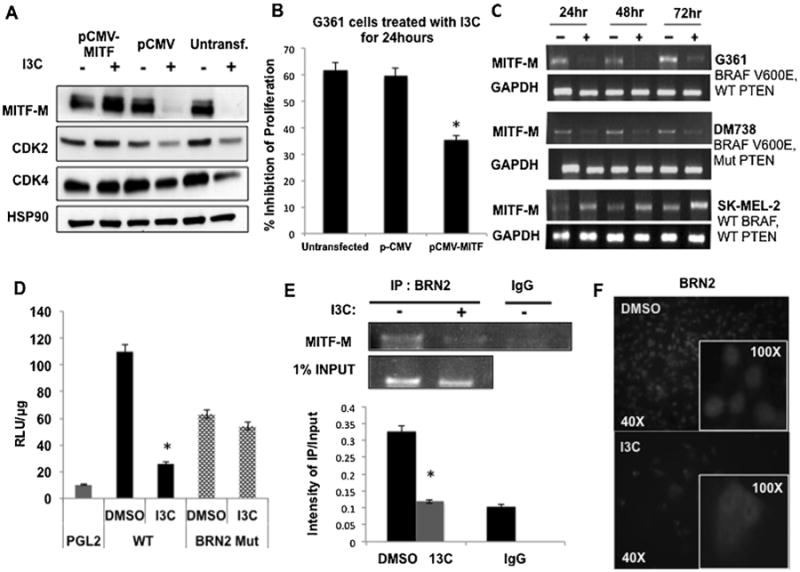
Figure 2.

Role of MITF-M in I3C anti-proliferative response and I3C regulation of MITF-M gene expression. (A) G-361 cells were either transfected with pCMV-MITF expression vector, or pCMV empty vector control or left untransfected, and each set of cells were treated with or without 200 μM I3C for a submaximal time of 24 h. Levels of MITF-M, CDK2, CDK4, and HSP90 protein were determined by western blots. (B) Cell proliferation was measured using a CCK-8 assay, and results show the mean of three independent experiments ±SEM (*P<0.01) (C) MITF-M transcript expression in G-361 cells treated with or without 200 μM I3C was determined by RT-PCR analysis in comparison to the GAPDH control. (D) Cells were transfected with reporter plasmids containing either a wild type MITF-M promoter (WT), a BRN2 consensus site mutant (BRN2 Mut) or the PGL2 empty control vector. Luciferase specific activity was measured in cells treated with or without 200 μM I3C for 24 h. The bar graph shows the results of three independent experiments in triplicate ± SEM (*P<0.01). (E) ChIP assay was performed on G361 cells treated with or without 200 μM I3C for 48 h using BRN2 antibodies (IP:BRN2) or the control IgG with one percent input as the loading control. The bar graphs quantify the densitometry results from three independent experiments ± SEM (*P<0.01). (F) G-361 cells were treated with or without 200 μM I3C for 48 h and BRN2 localization was examined by immunofluorescence using anti-BRN2 antibodies. The insets show magnified portions of the larger fields.
