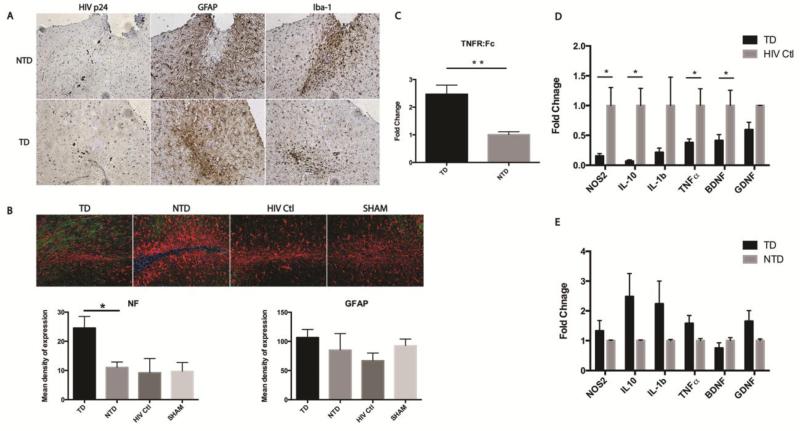
Figure 3.
Delivery of sTNFR by transduced BMDM demonstrated an anti-inflammatory effect in an HIVE model. Immunohistochemical staining of HIV p24 protein identified HIV-1 infected human MDM at injection site. Evaluation of astrogliosis and microgliosis by GFAP and Iba-1 staining revealed adoptive transplantation of sTNFr:Fc-GFP transduced BMDM attenuated the microgliosis surrounding injection site compared to transplantation of NTD cells. But no apparent reduction of astrogliosis was observed (A). GFAP/Neurofilament staining in the injection site were analyzed by Nuance multispectral imaging system (20X objective). The representative images are shown. Transduced group have significantly higher content of NF (green) staining in comparison with other groups. However, the difference in the intensity of GFAP was not statistically significant among groups (B). The expression of genes encoding TNFR:Fc, NOS2, IL1-β, TNF-α, NOS2, BDNF, and GDNF in brain subregions containing injection site were measured by real-time RT-PCR using SYBR green system and specific primers. n=5 in TD group, n=6 in NTD group, n=3 in HIV Ctl group. The expression of TNFR:Fc is more than two-fold higher in TD than in NTD brain (C). The expression of inflammatory cytokines including NOS2, IL-10, IL-1β, TNF-α and neurotrophic factors like BDNF and GDNF, is lower in TD than they are in HIV-Ctl brain (D). No significant differences in expression in TD group when compared to NTD group were found (E). For multispectral image quantifications, images were converted to 12 bit grayscale and quantified using ImagePro plus software. There are 3 animals in each group, and 4 sections of selected regions from each animal were analyzed and quantified. Each bar represented as mean ± SEM, P values were obtained using one way ANOVA test, * p < 0.05. Antibodies used include mouse anti-Neurofilament (1:200, Clone 2F11, Dako, CA), polyclonal rabbit anti-GFAP (1:1000, Dako, CA), and rabbit anti- Iba1 (1:500, Wako, VA). For real-time RT-PCR, Ct values of each target gene were normalized to values for GAPDH in each sample. To calculate relative amounts mRNA, the average Ct values were subtracted from GAPDH values for each target gene to provide changes in Ct value. Fold Change in expression was calculated as log2 relative units. Multiple t tests using Holm-Sidak method were applied for statistical analysis. Each bar represent mean ± SEM with *p < 0.05, **p < 0.01

