Figure.
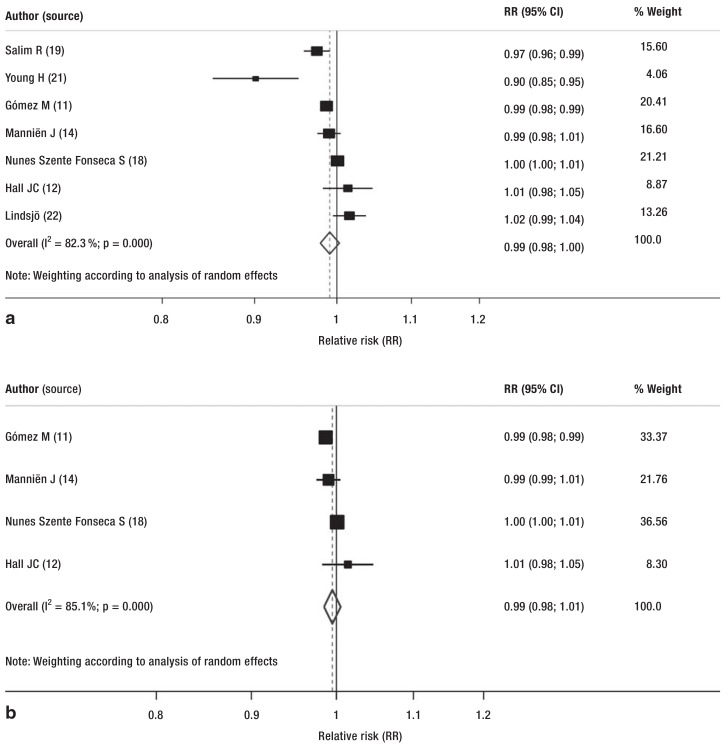
Subgroup analyses presented as forest plots:
a) Forest plot of all studies comparing postoperative infections before and after the intervention (relative risk [RR], unadjusted);
b) Forest plot of subgroup analysis of studies (before/after and RCT) in which antibiotic prophylaxis was the intervention
CI, confidence interval; RCT, randomized controlled trial

