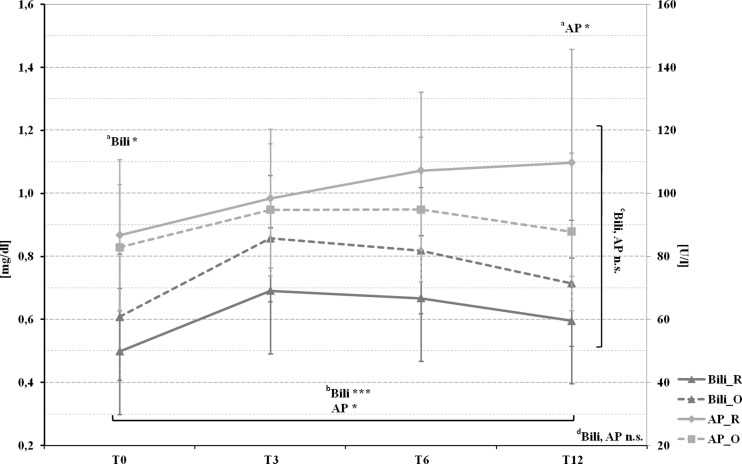
Fig. 3.
Pre- and postoperative mean bilirubin and alkaline phosphatase levels in patients with Roux-en-Y gastric bypass (marked by a full line) and omega-loop gastric bypass (marked by a dotted line). a T Test comparing Roux-en-Y gastric bypass and omega-loop gastric bypass at baseline (T0), 3 (T3), 6 (T6), and 12 (T12) months. Linear mixed model (LMM), adjusted for baseline values, sex, and age for changes over btime course, cbetween groups, and dchanges over time course and between groups. *p < 0.05; **p < 0.01; ***p < 0.001; n.s. not significant

