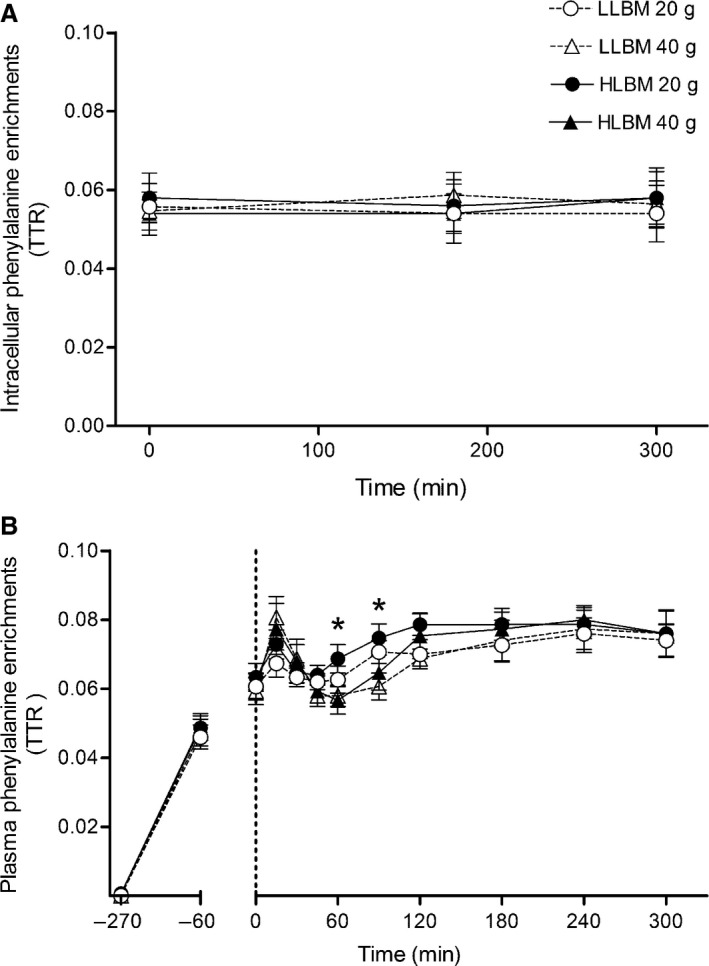
Figure 3.

Muscle intracellular (A) and plasma (B) phenylalanine enrichments expressed over time during L‐ [ring‐13C6] phenylalanine infusion in both the lower lean body mass (LLBM) and higher lean body mass (HLBM) groups. Data presented as means with 95% confidence intervals. Data expressed as tracer to tracee ratio (TTR). Ingestion of either 20 or 40 g whey protein isolate occurred at 0 min. *Significant difference between doses (P < 0.05).
