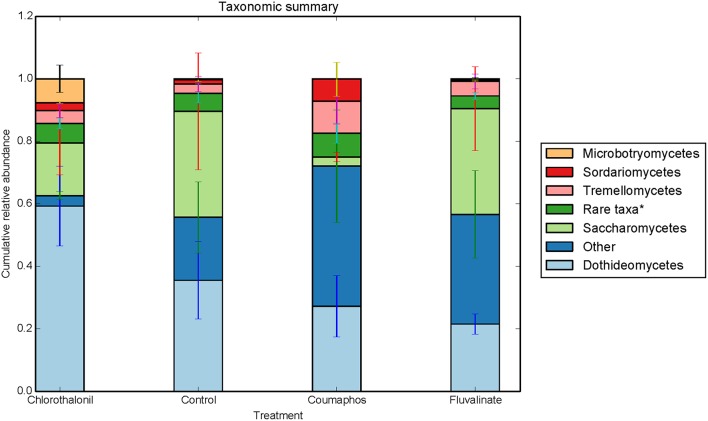
Figure 3.
Relative abundance of fungal taxa (class) in control, coumophos, fluvalinate, and chlorothalonil treated honey bees. Each column in the graph is the average (n = 6) of the percentage abundance of each taxa in each pesticide treatment. “Rare taxa* indicates classes that were < 2% in average abundance across all samples.”

