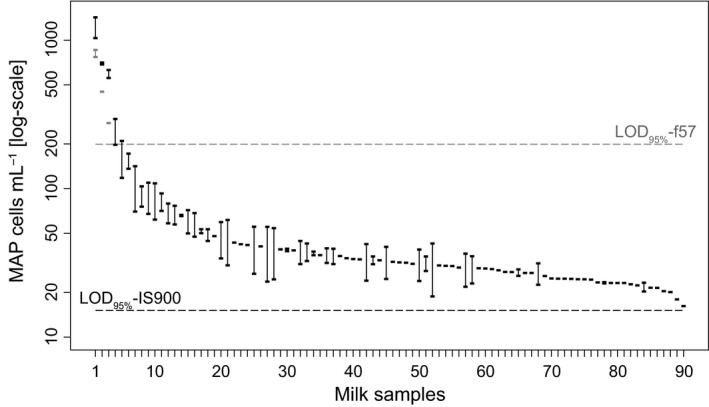
Figure 2.

Estimated MAP concentration in the quantifiable bulk tank milk samples obtained through qPCR (targets: IS900 in black, f57 in gray). Dashed lines represent the limit of detection of 95% for IS900 (black) and f57 (gray) targets. Rectangles represent the point estimates of MAP cells mL−1 for a given sample. Vertical lines represent samples with two quantifiable reactions. MAP, Mycobacterium avium subsp. paratuberculosis.
