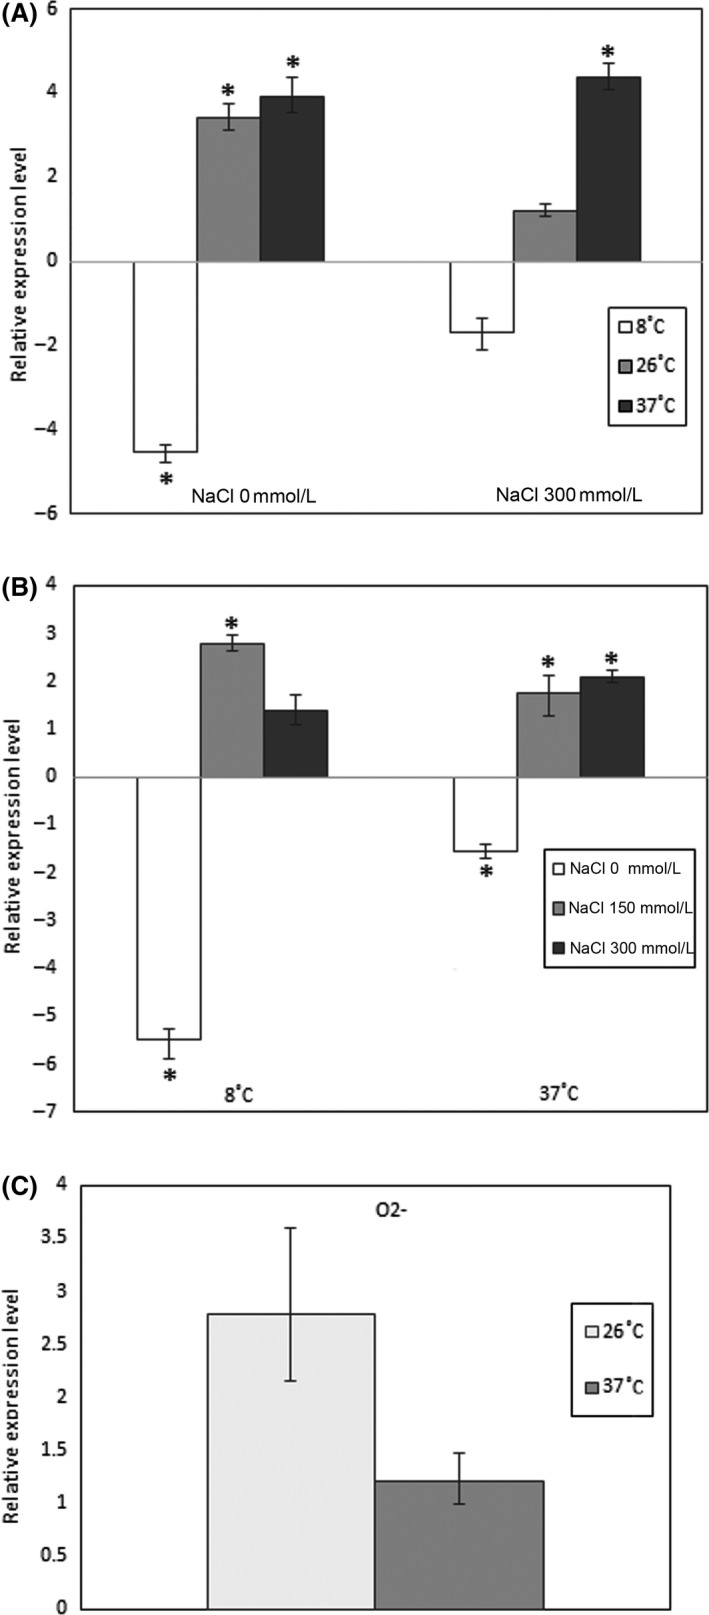
Figure 5.

OmpY relative expression under different environmental conditions. (A) Effect of media osmolarity, 150 mmol/L NaCl condition was used as a reference. (B) Effect of cultivation temperature, 26°C condition was used as a reference. (C) Effect of oxygen availability, aerobic condition was used as a reference. Expression levels are reported as fold change compared to average expression levels of reference groups. Columns represent the mean of triplicate measurements in two independent experiments; error bars represent the standard deviations. Asterisks above bars indicate significant differences compared to the reference (P < 0.05).
