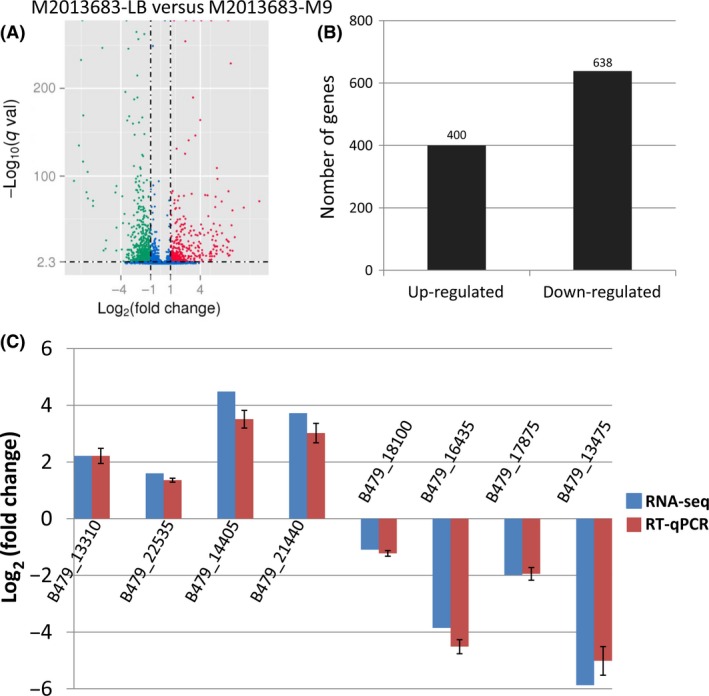
Figure 3.

Comparison of differentially expressed genes identified between M2013683‐LB and M2013683‐M9. (A) Volcano Plots analysis of differentially expressed genes. The red dots represent differentially expressed genes (DEG)s up‐regulated in M2013683‐LB sample, the green dots represent DEGs down‐regulated in M2013683‐LB sample, and the blue dots represent not DEGs. (B) Quantitative statistic of differentially expressed genes. (C) Comparison of the expression level of the selected differently expressed genes as determined by RNA‐sequencing and RT‐qPCR
