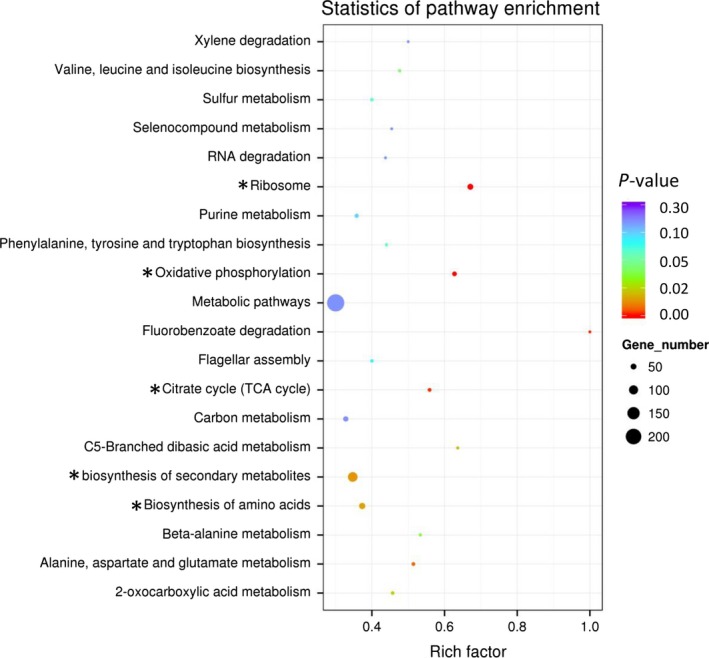
Figure 5.

Scatterplot of differentially expressed genes enriched KEGG pathway. Rich factor represents the ratio of the number of differentially expressed genes (DEG)s and the number of all genes in the pathway. Top five pathways significantly enriched were marked with asterisks.
