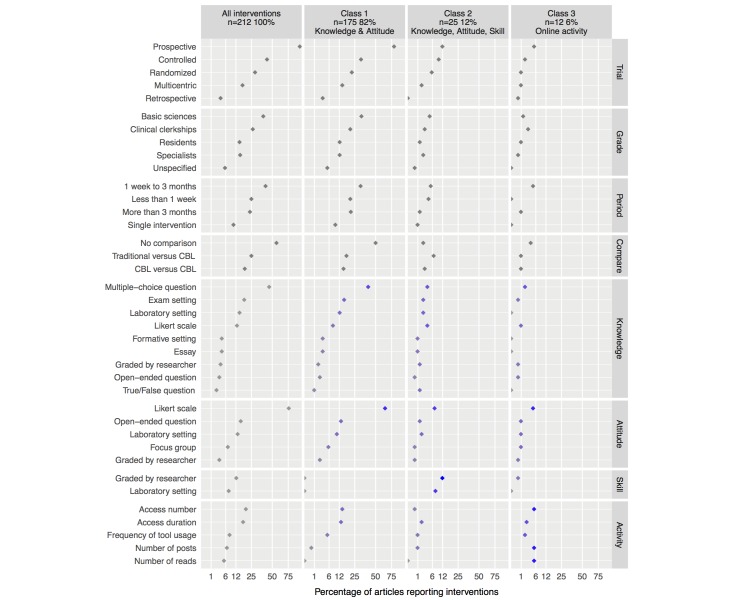
Figure 5.
Prevalence of articles per intervention feature and intervention endpoint latent class. Horizontal axis ranges between 0 and 100 on a squared root scale. Point color specifies the probability of assigning a paper to each class based on the presence of each variable (gray indicates a probability of 0, ranging to dark blue indicating the highest probability). Only variables regarding assessment of knowledge, attitudes, skills, and online activity (the 4 last panels) were used to determine intervention end point latent classes. CBL: computer-based learning.

