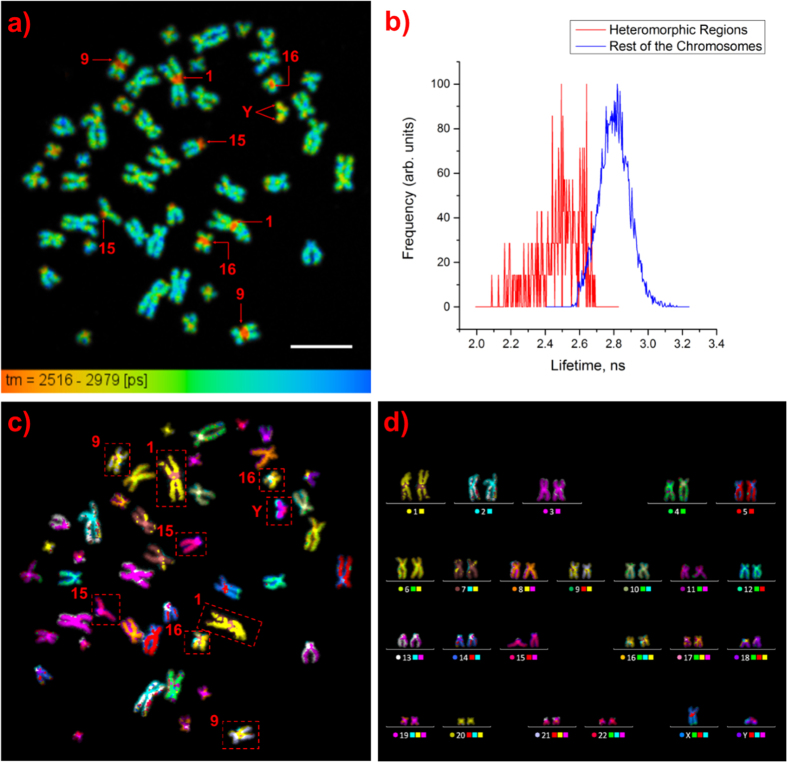
Figure 2. Identification of heteromorphic regions in chromosomes.
(a) Lifetime image of a chromosome spread with arrows showing the heteromorphic regions (scale bar = 10 μm). (b) Normalized lifetime distribution curves for the heteromorphic regions and the rest of the chromosomes showing shorter DAPI lifetimes for the heteromorphic regions than for the rest of the chromosomes. (c) mFISH image of the measured chromosome spread. (d) Karyotyping of the chromosomes in Fig. 2a,c based on color.

