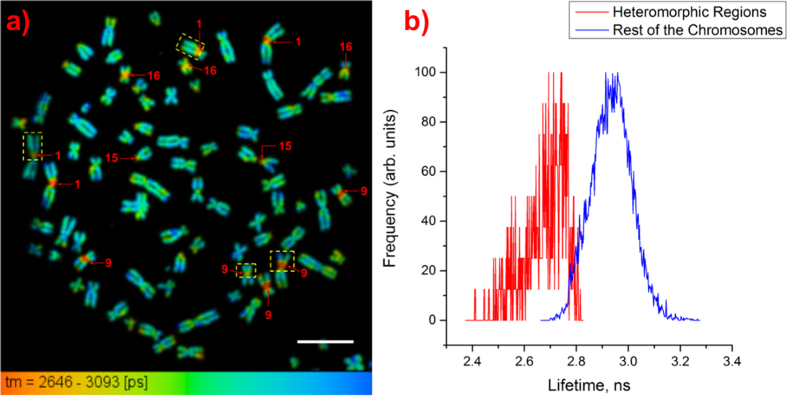
Figure 5. Identification of heteromorphic regions in chromosomes obtained from HeLa cells.
(a) Lifetime image of a chromosome spread with arrows showing the heteromorphic regions. The chromosomes enclosed in a yellow dashed square are the abnormal chromosomes (scale bar = 10 μm). (b) Normalized lifetime distribution curves for the heteromorphic regions and the rest of the chromosomes showing shorter DAPI lifetimes for the heteromorphic regions than for the rest of the chromosomes.

