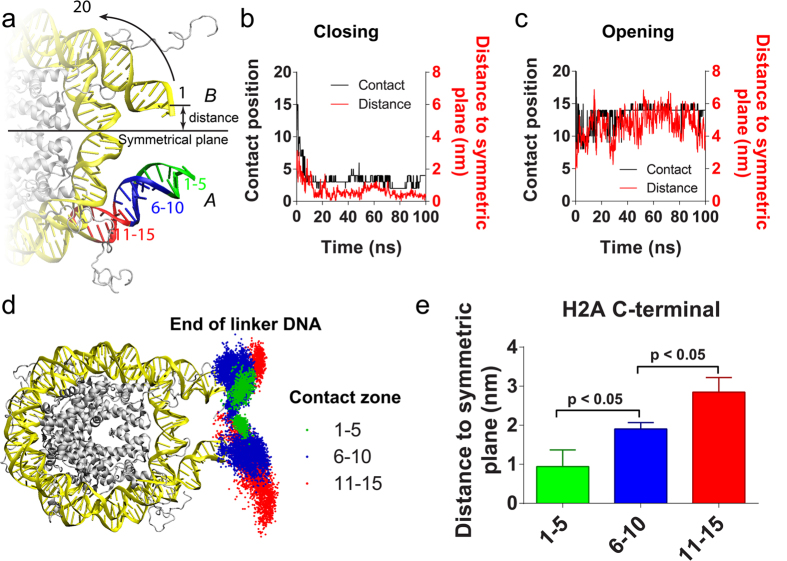
Figure 3. The correlation between the DNA position that H2ACtT interacted with and linker DNA motility.
(a) Schematic of DNA base pair labeling rule and three contact regions on DNA. (b,c) Show the DNA positions that H2ACtT contacted with (black curve) and the distance from the linker DNA end to the symmetric plane (red curve), along with the simulation time in the closed and open simulations. (d) The distribution of linker DNA end locations sampled in all 10 simulations. Each point in the figure represents a location of the linker DNA end. The points were classified into three groups according to the regions where H2ACtT was in contact with DNA. When H2ACtT contacts DNA at 1–5 bp from the end, the points were colored in green; for 6–10 bp from the end, the points were colored in blue; for 11–15 bp from the end, the points were colored in red. (e) The average distance from the linker DNA end to the symmetric plane of the above three groups. Standard errors in the figure are calculated from the independent distances obtained from different simulation runs. The P-value is calculated by two-tailed t-test.

